-
 January 21, 2025
EURJPY Consolidates, GBPCAD Breaks Resistance, EURCHF Uptrend Continues
EURJPY The EURJPY chart exhibits a mixed market structure with recent price movements reflecting consolidation after a period of volatility. Currently trading at 161.300, the price shows resistance near the...
-
 January 20, 2025
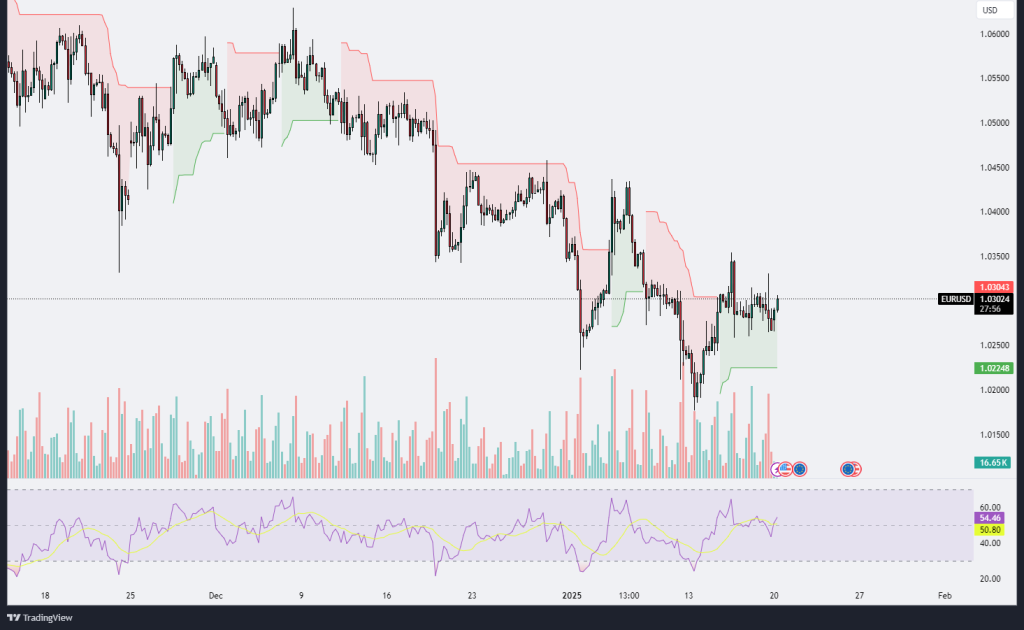
Technical Analysis 20.01.2025
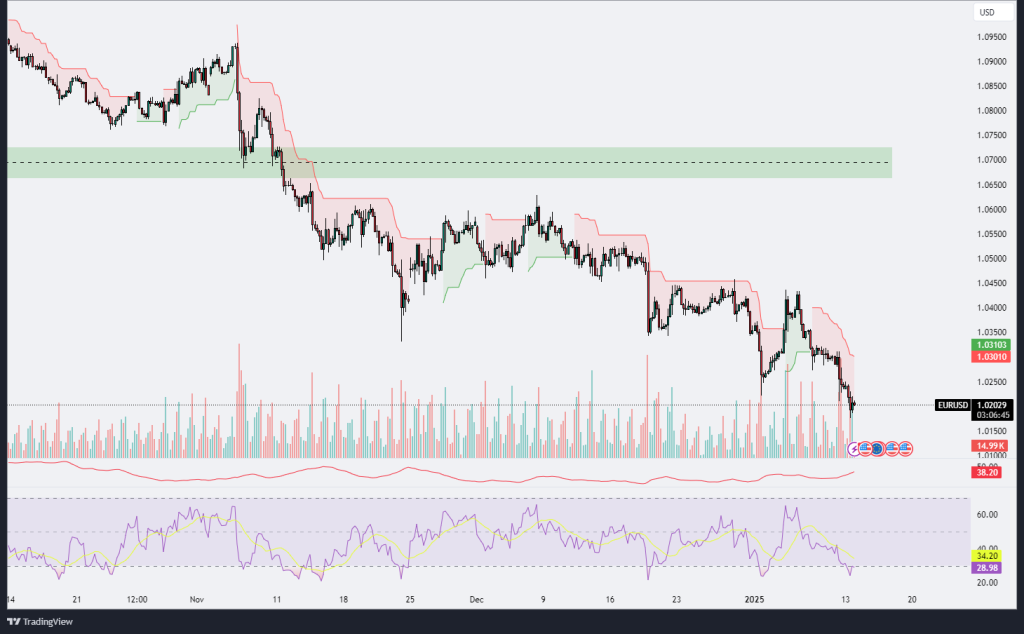
EURUSD The EURUSD chart displays a consolidation phase following a downward trend that found support near the 1.0225 level. Currently, the price is trading around 1.0304, slightly above the Ichimoku...
-
 January 17, 2025
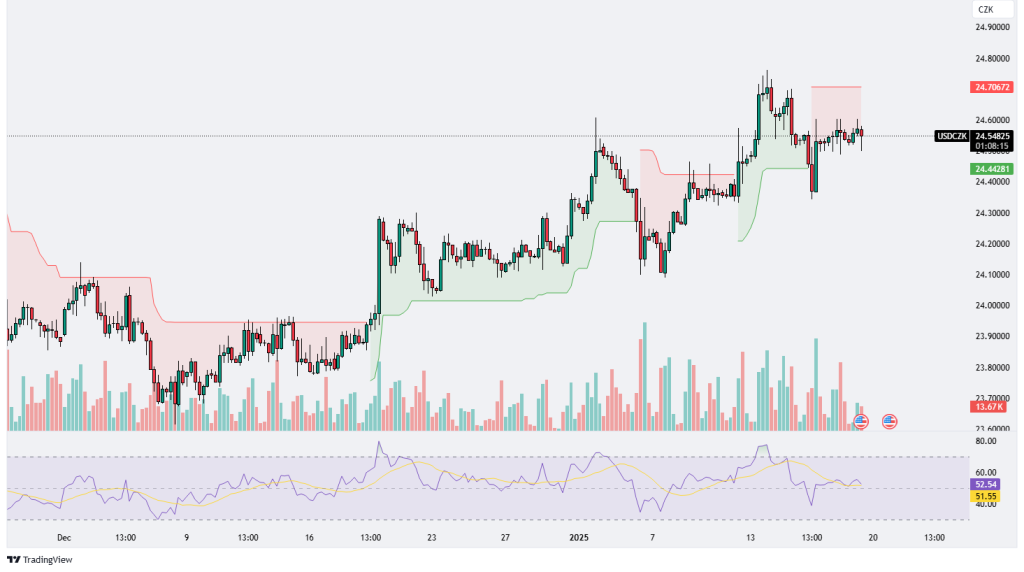
Technical Analysis 17.01.2025
USDCZK The USD/CZK chart demonstrates a bullish trend with signs of consolidation after a recent upward breakout. The price has established a higher low structure and is currently trading within...
-
 January 16, 2025
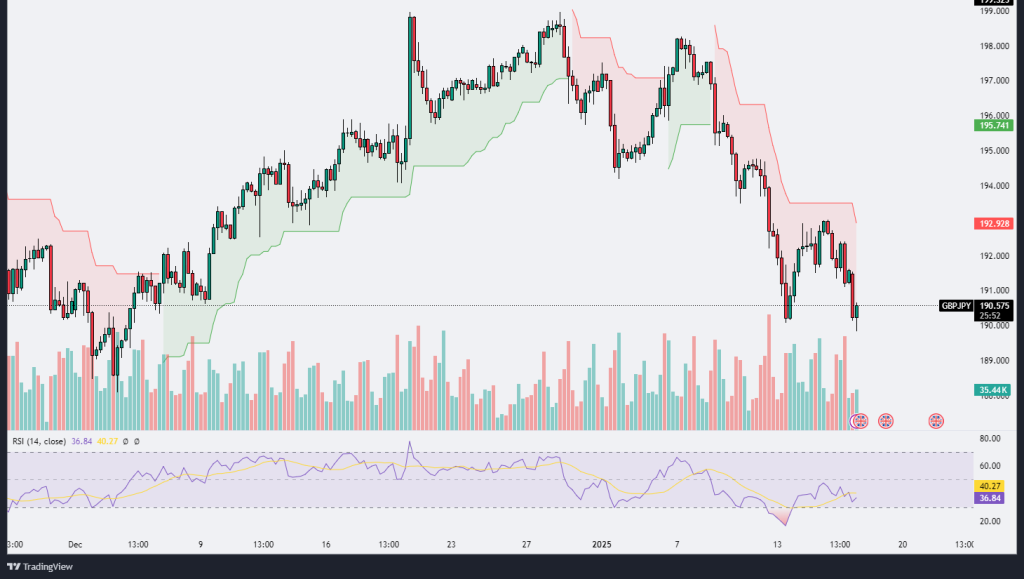
Technical Analysis 16.01.2025
GBPJPY The GBP/JPY chart reveals a notable bearish trend as the pair breaks below key support levels, currently trading near 190.57. The Ichimoku cloud shows that prices are well below...
-
 January 15, 2025
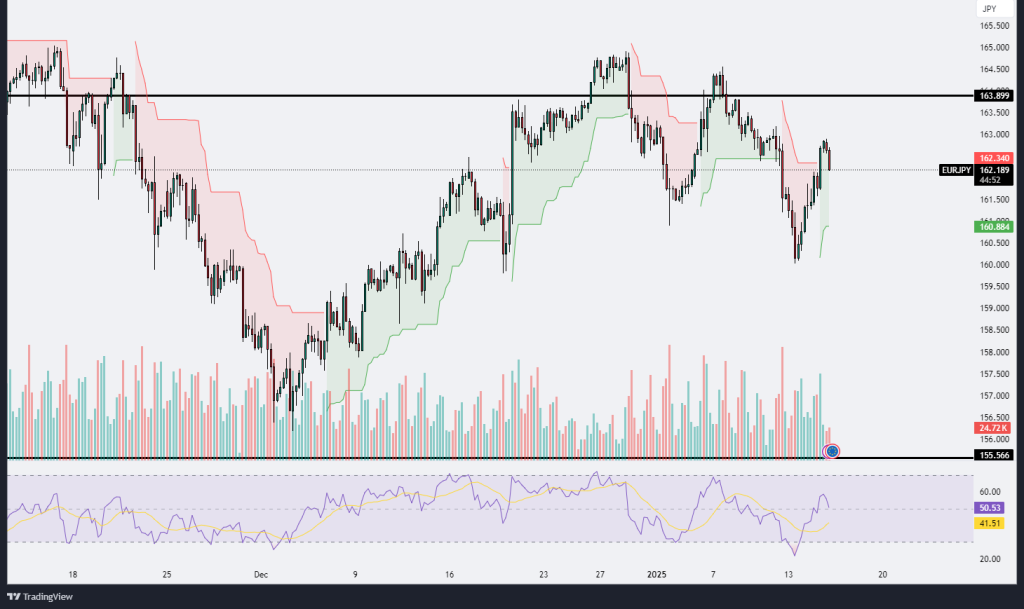
Technical Analysis 15.01.2025
EURJPY The EUR/JPY chart shows the pair struggling near the 162.34 level after a significant rebound from the recent lows around 160.88. The price attempted to recover from the prior...
-
 January 13, 2025
Technical Analysis 13.01.2025
EURUSD The EUR/USD chart demonstrates a persistent downtrend, as the price continues to trade below the Ichimoku cloud, indicating a bearish bias. The recent decline has pushed the price to...
-
 January 07, 2025
Technical Analysis 07.01.2025
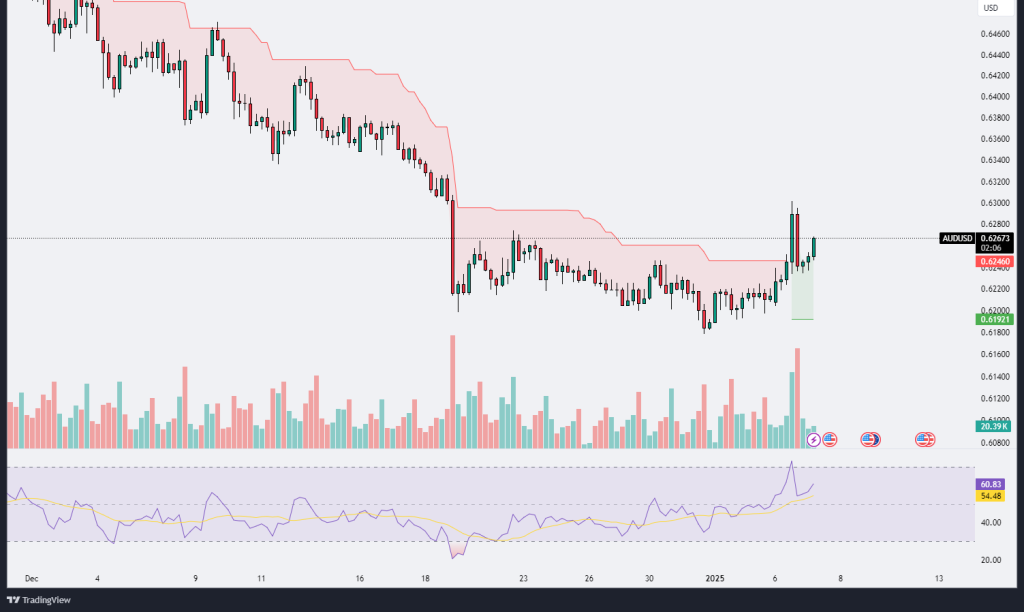
AUDUSD The AUD/USD chart displays a significant bullish breakout following a prolonged consolidation phase, with the price moving above the Ichimoku cloud resistance. Currently trading around the 0.62673 level, this...
-
 January 06, 2025
Technical Analysis 06.01.2025
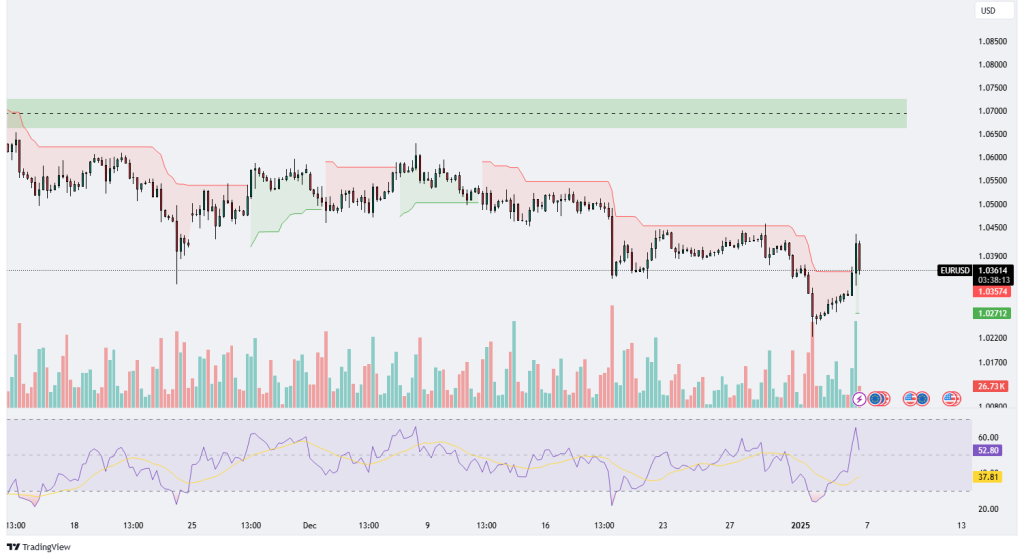
EURUSD The EUR/USD chart shows a notable spike in buying volume, signaling a strong bullish push after a period of consolidation and downward movement. The price has managed to recover...
-
 December 30, 2024
Technical Analysis 30.12.2024
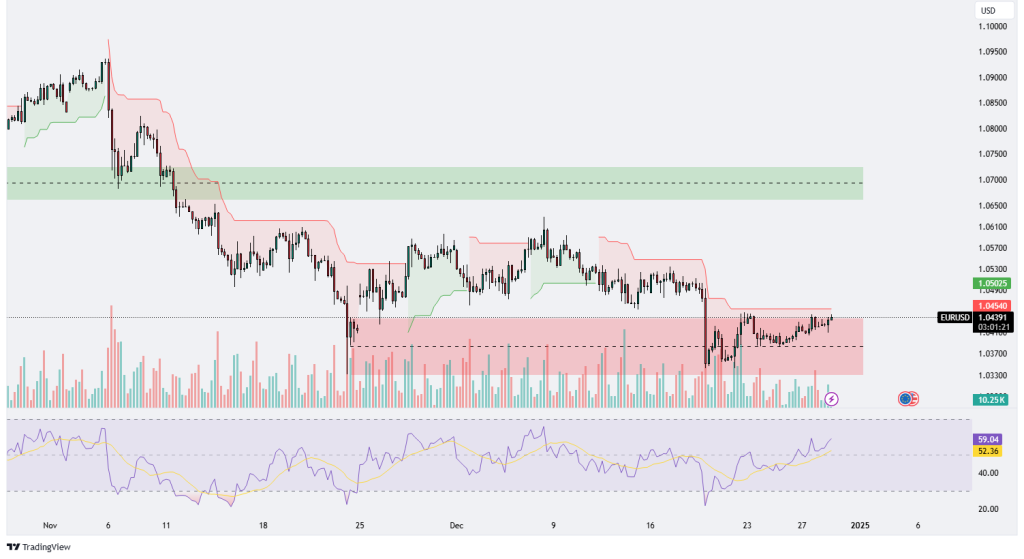
EURUSD The EUR/USD chart exhibits a consolidation phase within a well-defined range, as the price oscillates between the lower boundary at 1.0370 and the upper resistance near 1.0500. The Ichimoku...
-
 December 20, 2024
Technical Analysis 20.12.2024
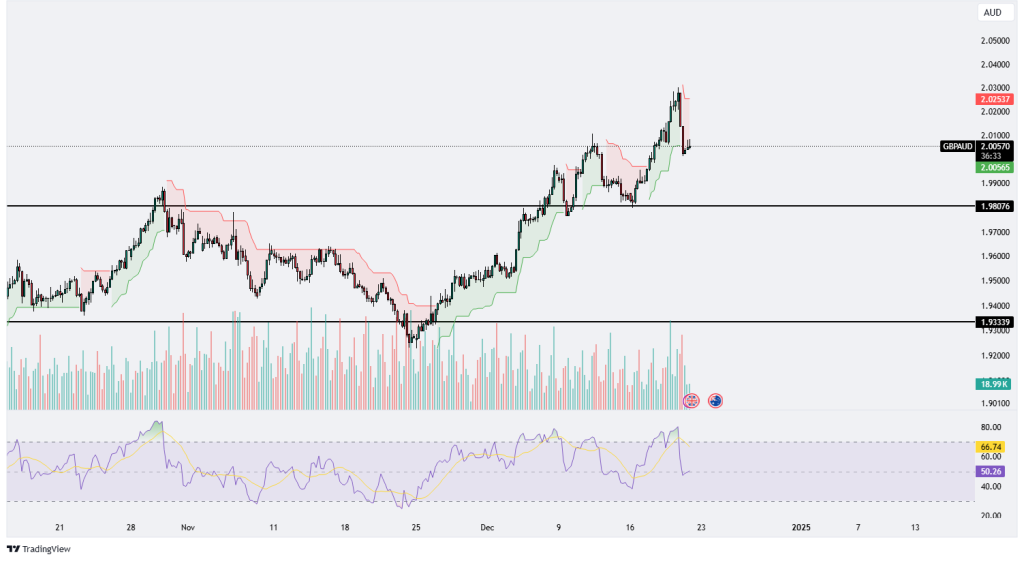
GBPAUD The GBPAUD chart indicates a recent rejection near the 2.03000 level, suggesting strong resistance in that area, as evidenced by the sharp pullback. The price has retraced to around...
-
 December 19, 2024
TechnicalAnalysis 19.12.2024
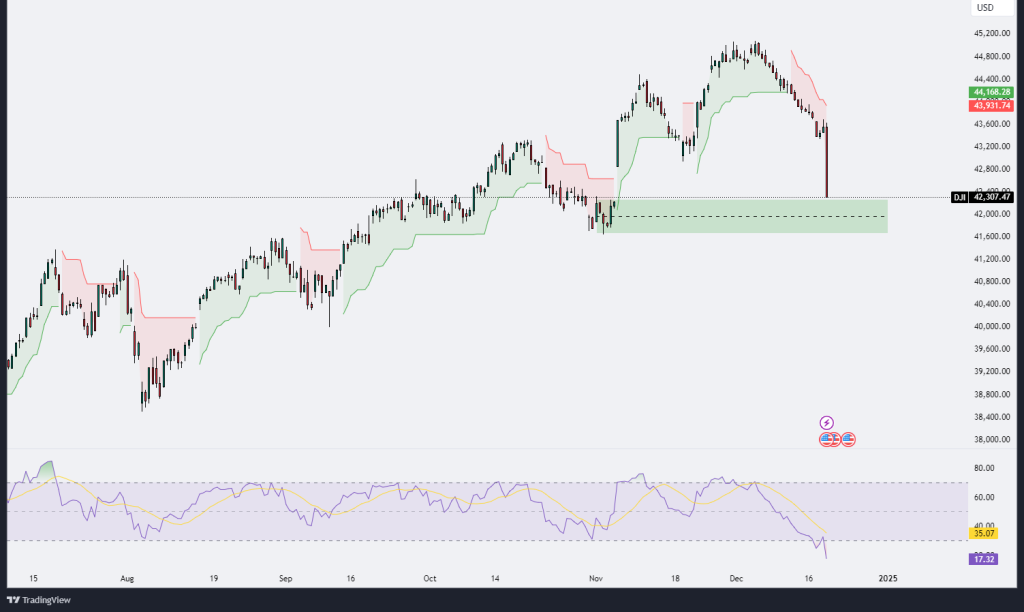
DOW JONES INDUSTRIAL The Dow Jones Industrial Average (DJI) chart shows a sharp decline in price, with the index dropping to 42,307.47 after reaching recent highs near 44,400. This dramatic...
-
 December 18, 2024
Technical Analysis 18.12.2024
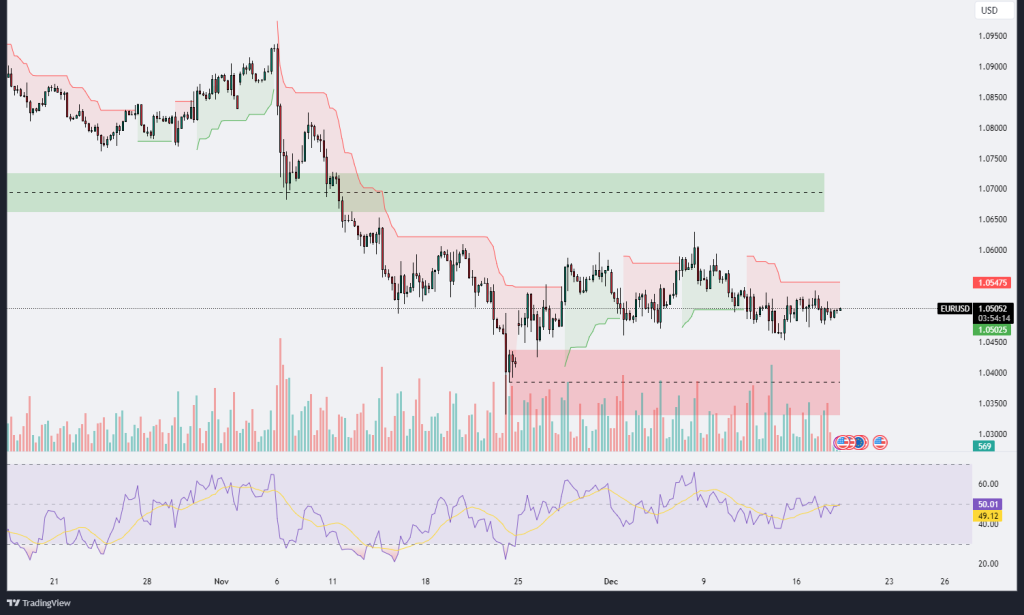
EURUSD The EUR/USD chart reflects a range-bound market environment, trading at approximately 1.05051. The pair is sandwiched between a resistance zone near 1.05475 and a significant support area around 1.04500,...
