


This multi-asset technical analysis reviews the latest price action across indices, forex pairs, and equities. As key resistance levels are tested, traders are evaluating breakout potential and monitoring whether recent momentum can sustain or fade.
Multi-Asset Technical Analysis: NASDAQ Futures Breakout
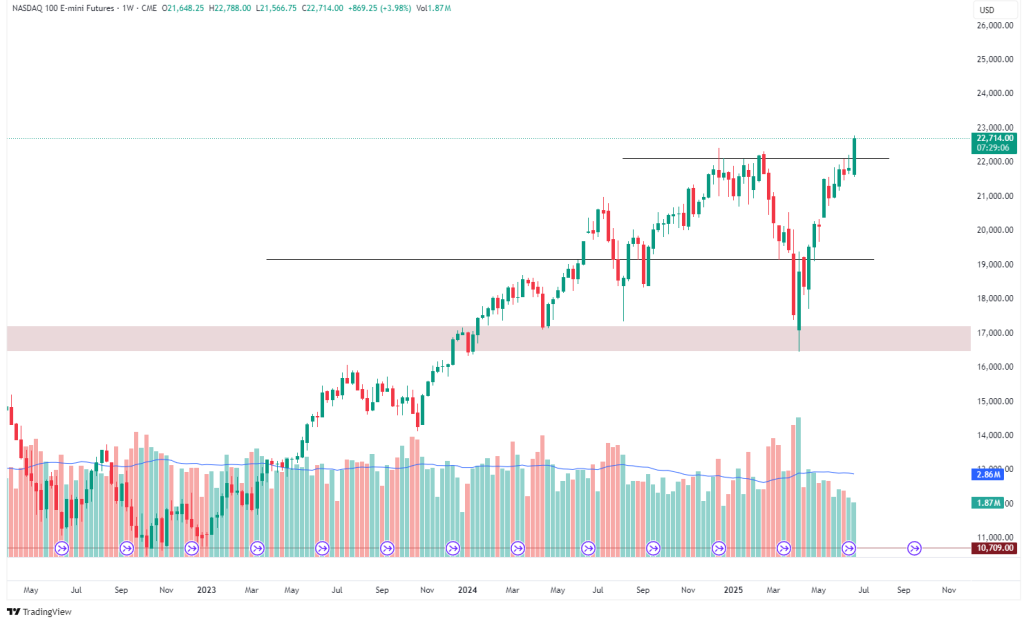
The NASDAQ 100 E-mini Futures decisively broke above the long-standing resistance zone near 22,700, closing the week with a strong bullish candle and significantly higher volume. This breakout points to continued strength within the broader uptrend. The next psychological resistance is between 23,500 and 24,000. If price successfully retests the broken resistance and holds above it, this will confirm the bullish continuation thesis. Traders should watch intraday pullbacks and volume divergence to assess buyer conviction and the possibility of fresh all-time highs in the coming sessions.
EUR/USD: Testing Channel Resistance
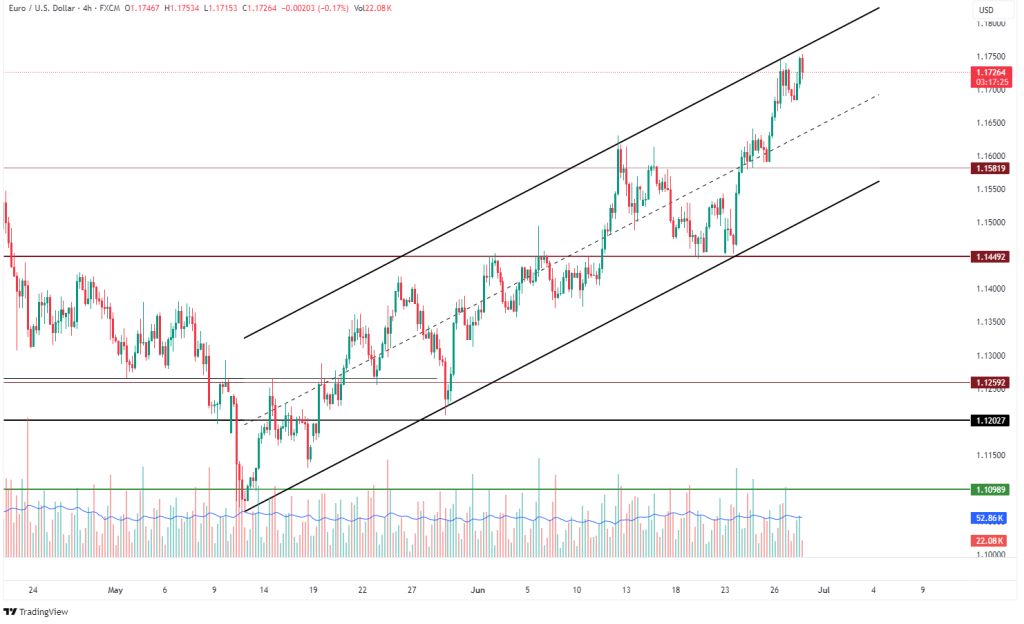
EUR/USD continues to trade within a clearly defined ascending channel on the 4-hour chart. The pair is currently approaching the upper boundary around 1.1750, a level that has repeatedly acted as resistance. If this barrier holds, a pullback toward the channel midline or lower boundary near 1.1650–1.1600 is likely. Conversely, a confirmed breakout above the channel would signal renewed buying interest and open the way for a move toward 1.1800+. Volume confirmation and sustained closes above resistance will be essential to validate any breakout, especially given recent volatility.
Multi-Asset Technical Analysis: Nikkei 225 Retest at 40,000
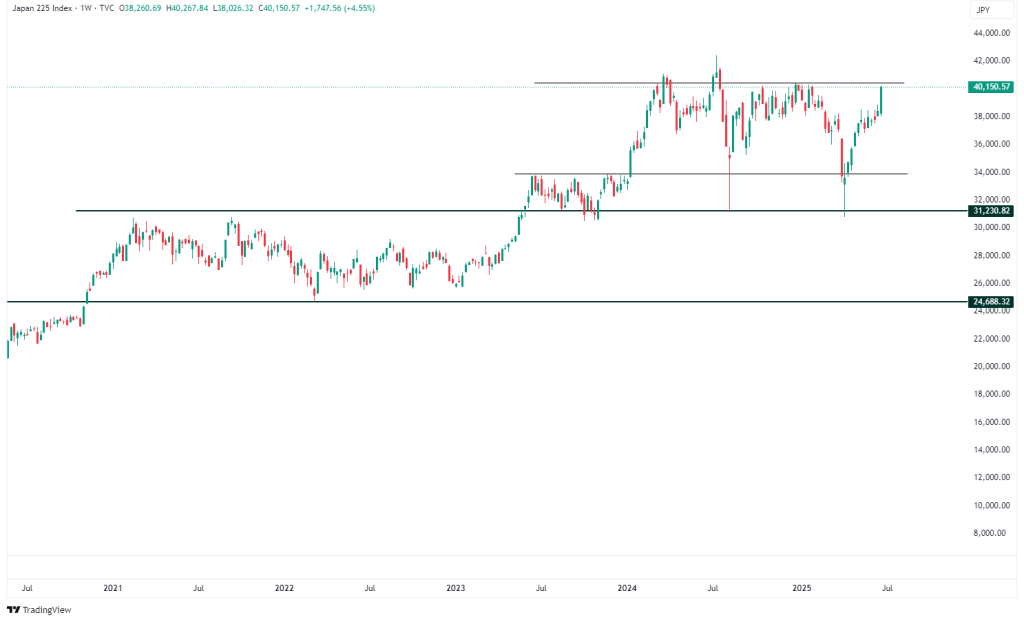
The Nikkei is retesting the 40,000 resistance zone, which previously capped multiple rallies. A breakout and weekly close above this level would confirm a new bullish leg higher. The long-term support at 31,200 and 24,600 remain strong structural levels. Buyers remain in control, especially after defending the higher low formed around 36,000.
META Platforms, Inc.: Resistance Revisited
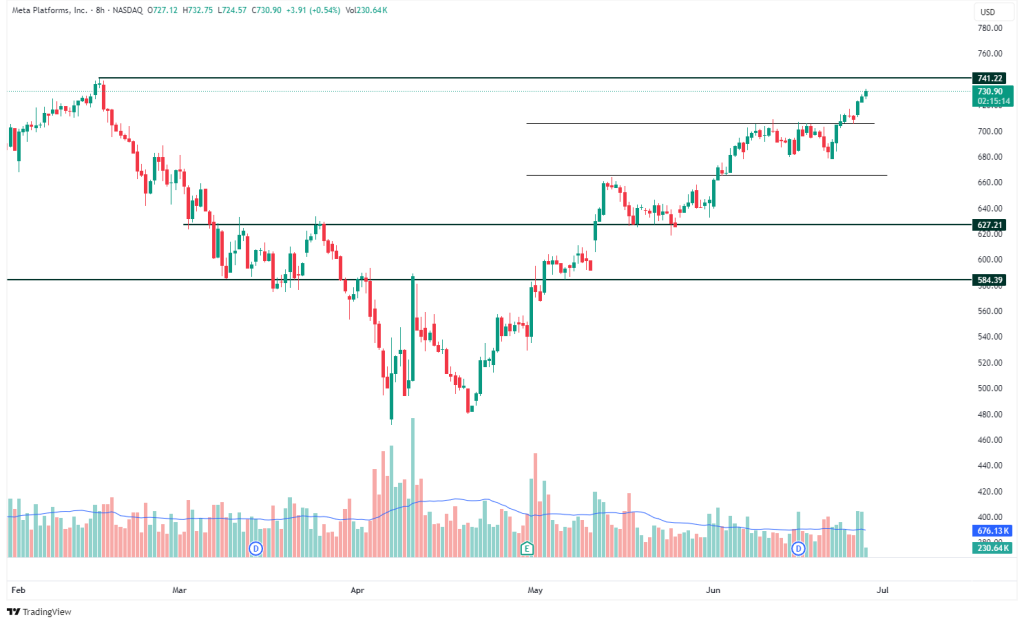
META stock is approaching the critical resistance level near 741, last tested earlier in the year. The price has formed a consistent pattern of higher highs and higher lows, reflecting a well-established bullish trend. If price breaks out above 741 with strong volume participation, the move could accelerate toward uncharted highs. Support levels are layered near 700, 660, and the major floor around 627. A failure to break resistance could trigger a temporary pullback, though overall sentiment remains firmly positive among large-cap tech traders.


Leave A Comment