


This multi-asset technical analysis covers recent developments across commodities, indices, and forex pairs. From Palladium’s channel rejection to GBP/JPY’s confirmed breakout, this report highlights important price zones, technical formations, and short-term momentum shifts that traders and analysts should be watching.
Multi-Asset Technical Analysis: Palladium’s Channel Reversal
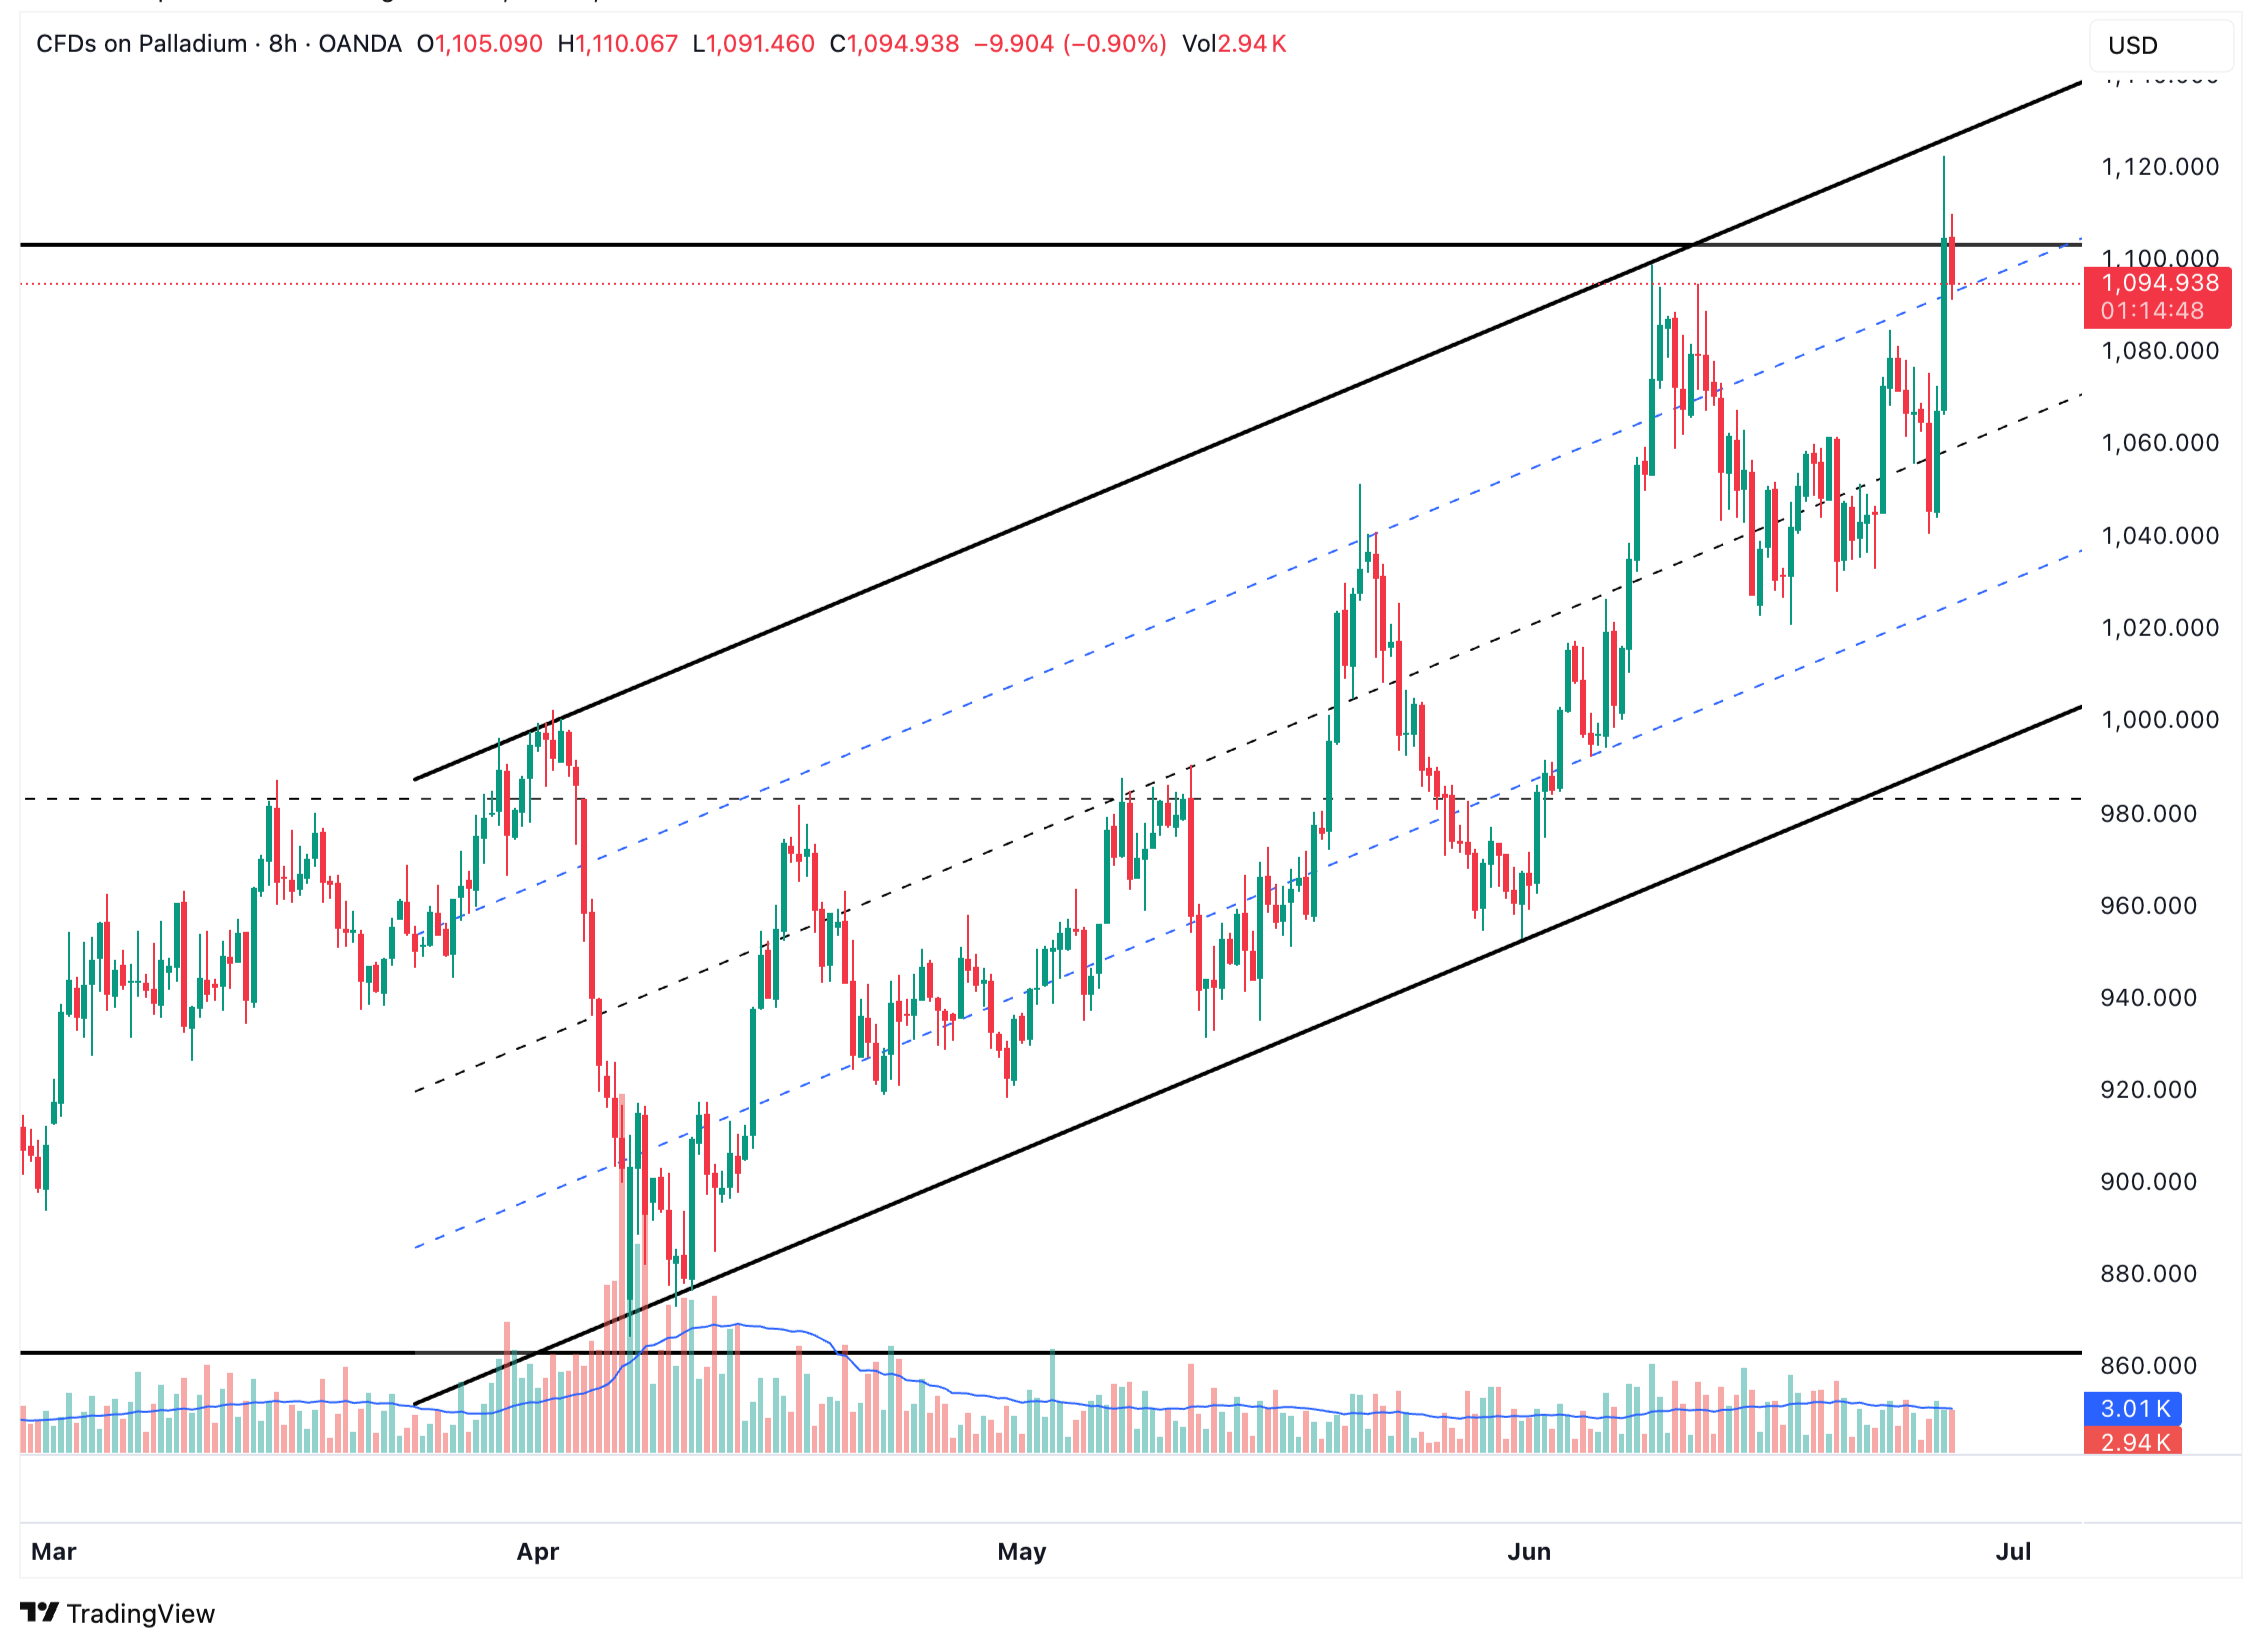
Palladium is trading inside an ascending channel, recently testing the upper resistance near 1,110 USD. The rejection aligned with both the channel boundary and an internal trendline, suggesting exhaustion. If pressure holds, a drop toward the mid-range (1,050–1,060 USD) or 1,000 is likely. A breakout above resistance would signal a fresh bullish leg.
EU Stocks 50: Holding the Breakout Zone
The index broke through a major resistance zone between 4,450–4,800 EUR and is now consolidating above it. Support has formed near 5,000 EUR, and as long as the price stays above this trendline, the uptrend remains intact. If broken, downside risk toward 4,800 could develop. Upside potential remains open toward 6,000+.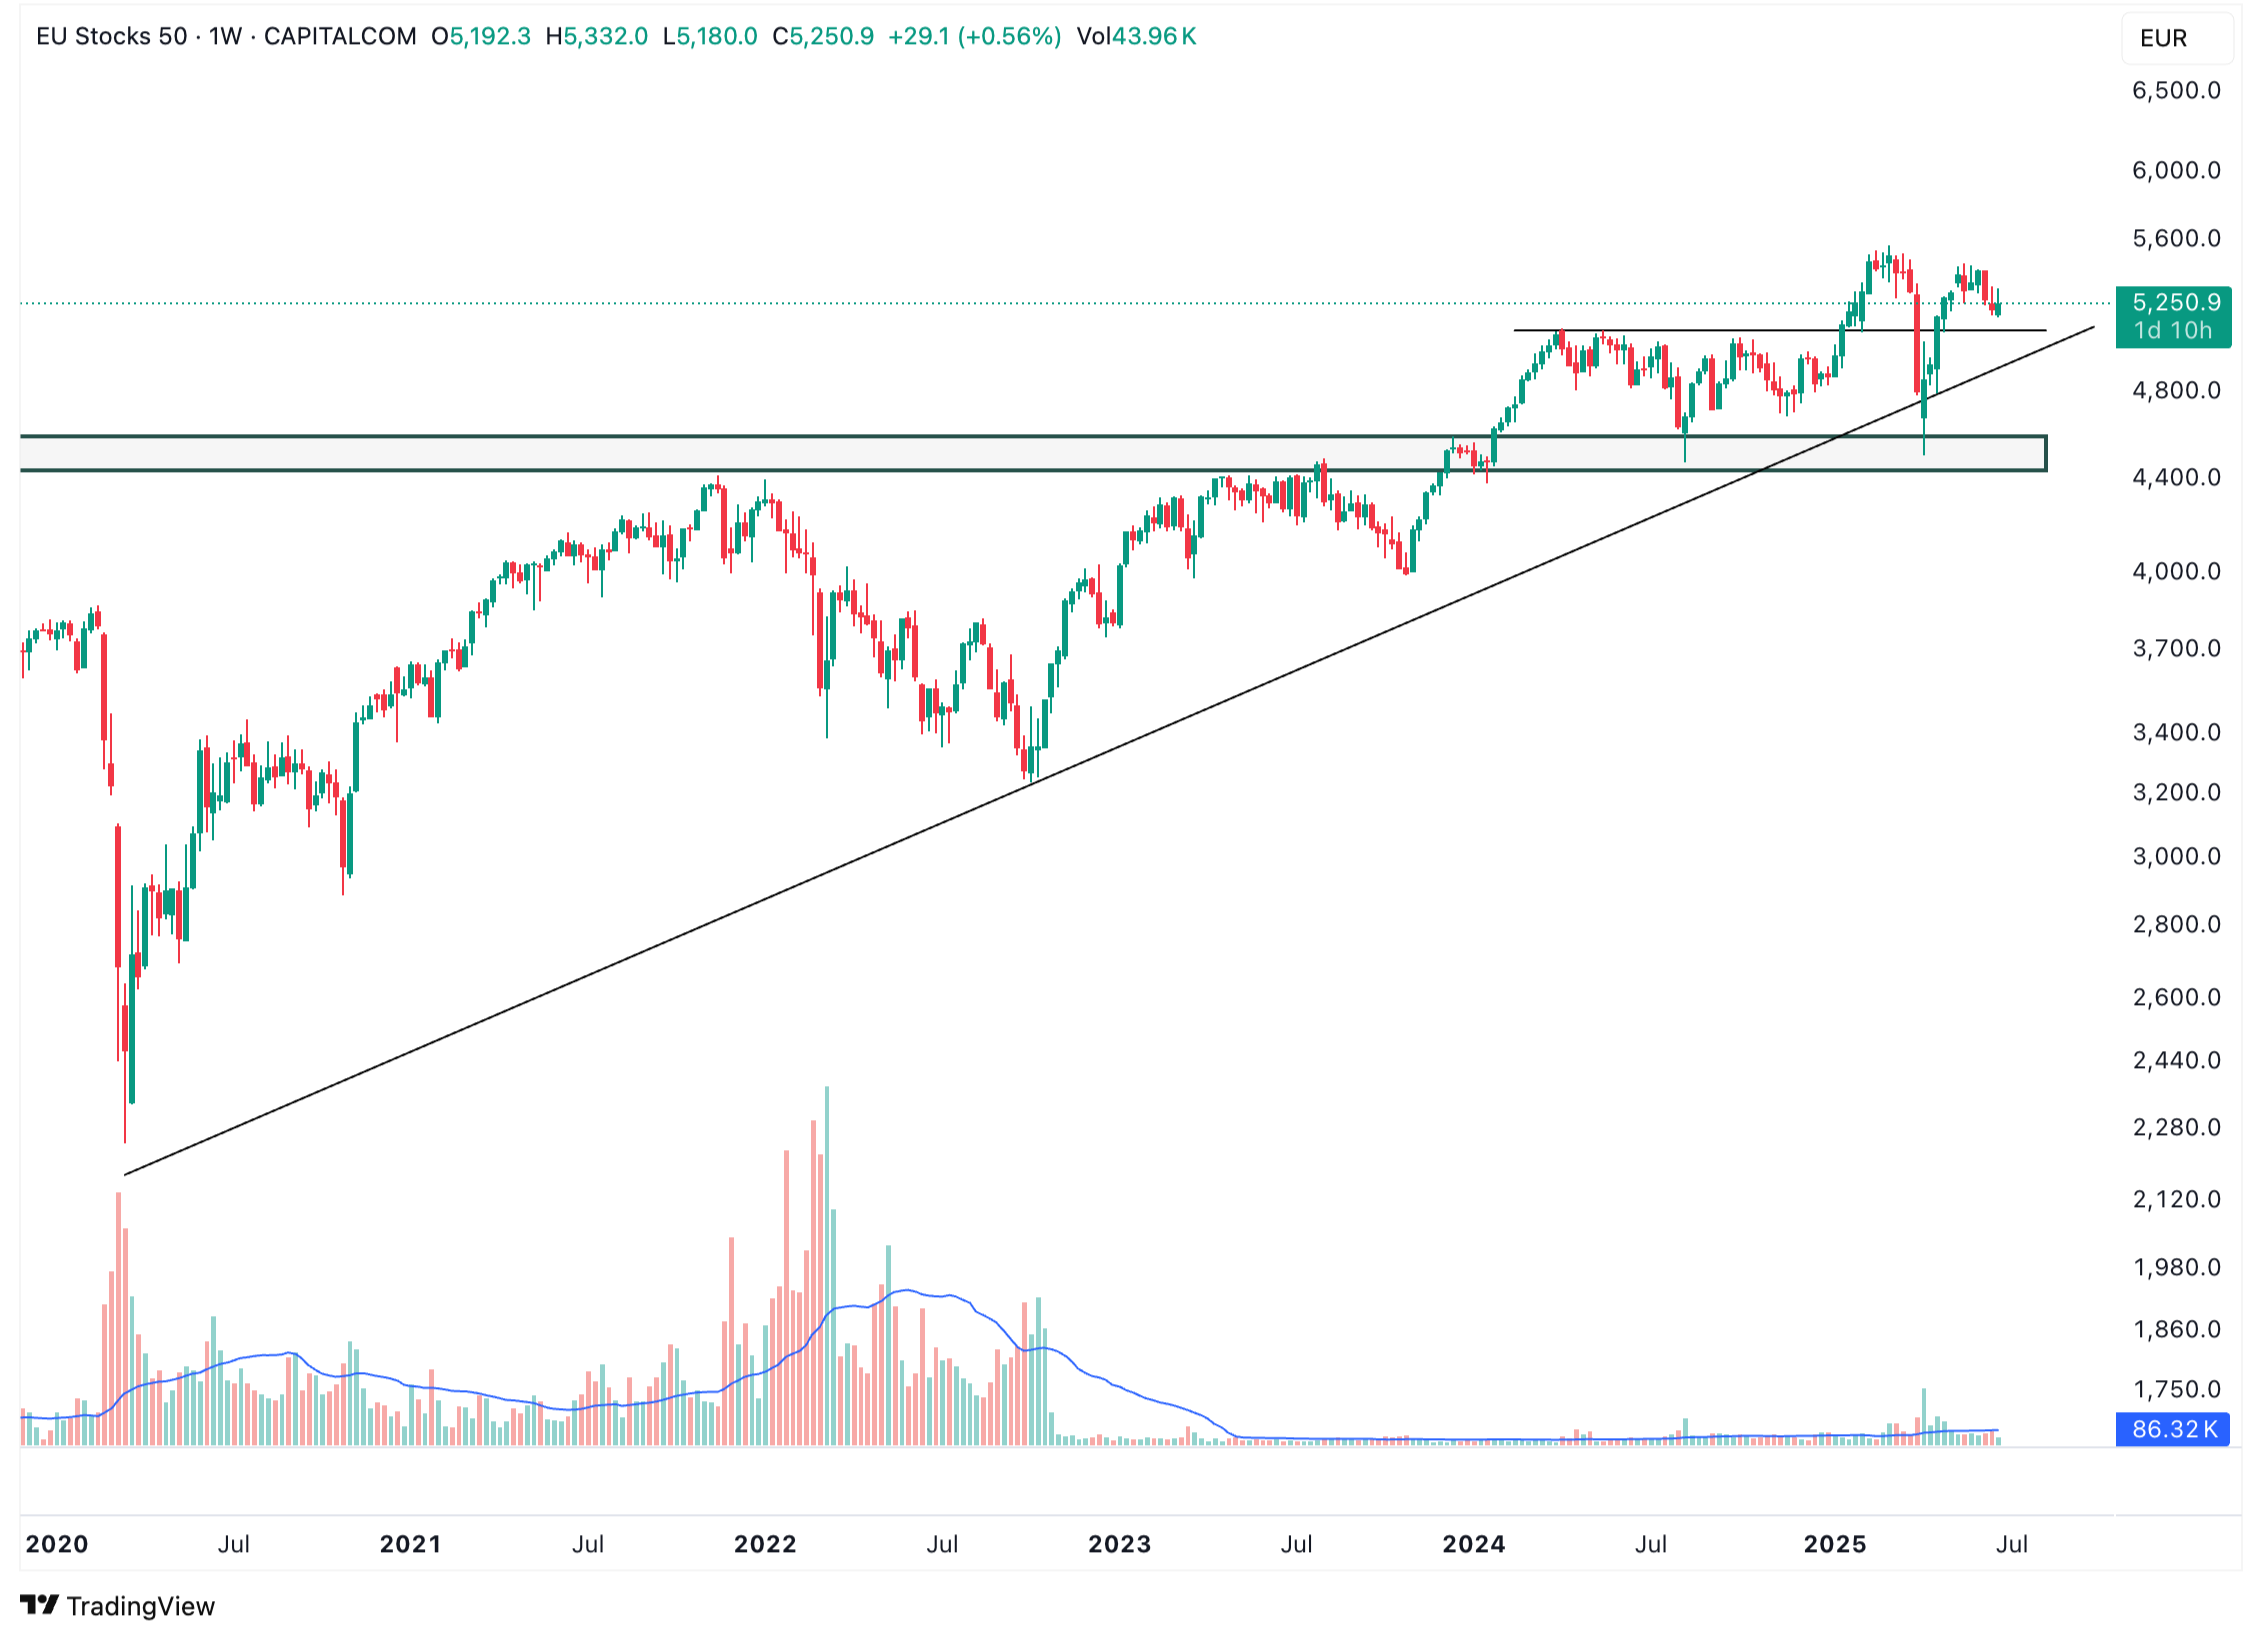
Cotton No 2: Range Trading Continues
Cotton remains range-bound between 6,520 and 6,900 USD. A recent test of resistance failed, confirming indecision. Until price escapes this zone, range-trading or mean-reversion setups are more favorable. A breakout above 6,900 targets 7,200, while a breakdown could aim for 6,300–6,200.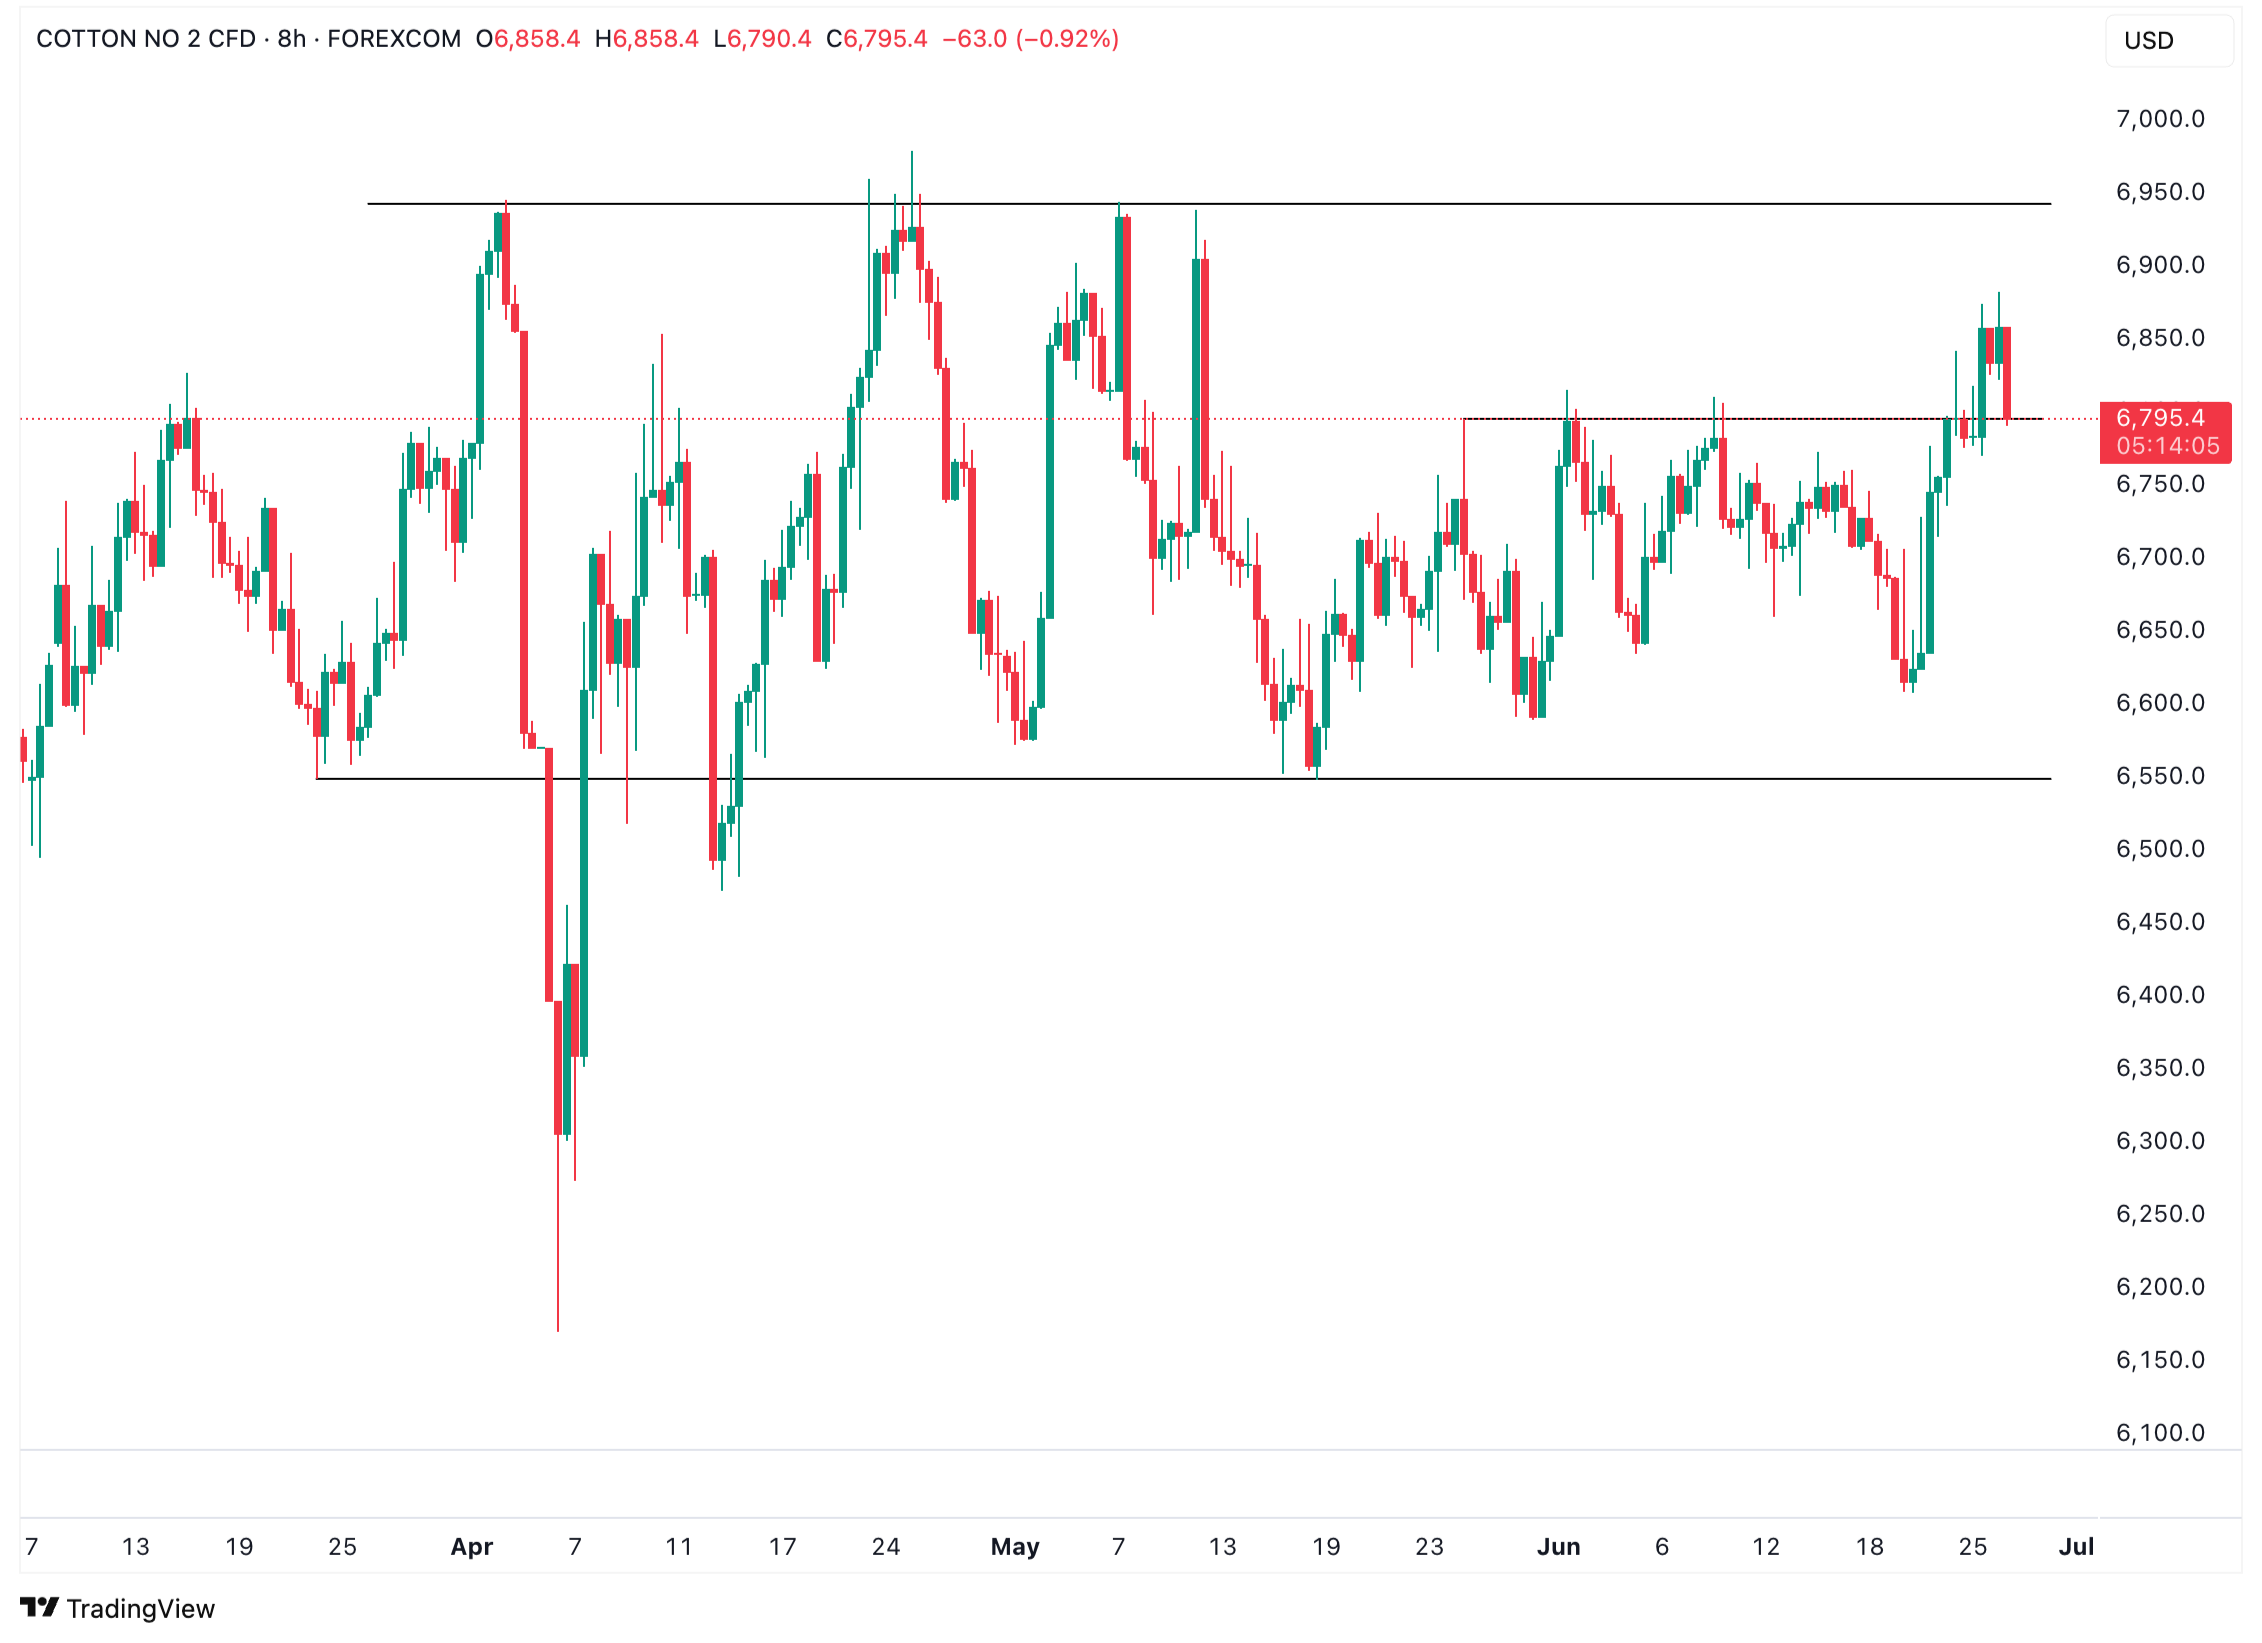
Multi-Asset Technical Analysis: GBP/JPY Breakout Momentum
GBP/JPY broke above horizontal resistance near 196.80 JPY, completing an ascending triangle. The move was confirmed by rising volume and bullish candles. Now consolidating above 197.80, if this support holds, price may continue toward the 200.00 mark. A false breakout scenario would emerge if price re-enters the triangle.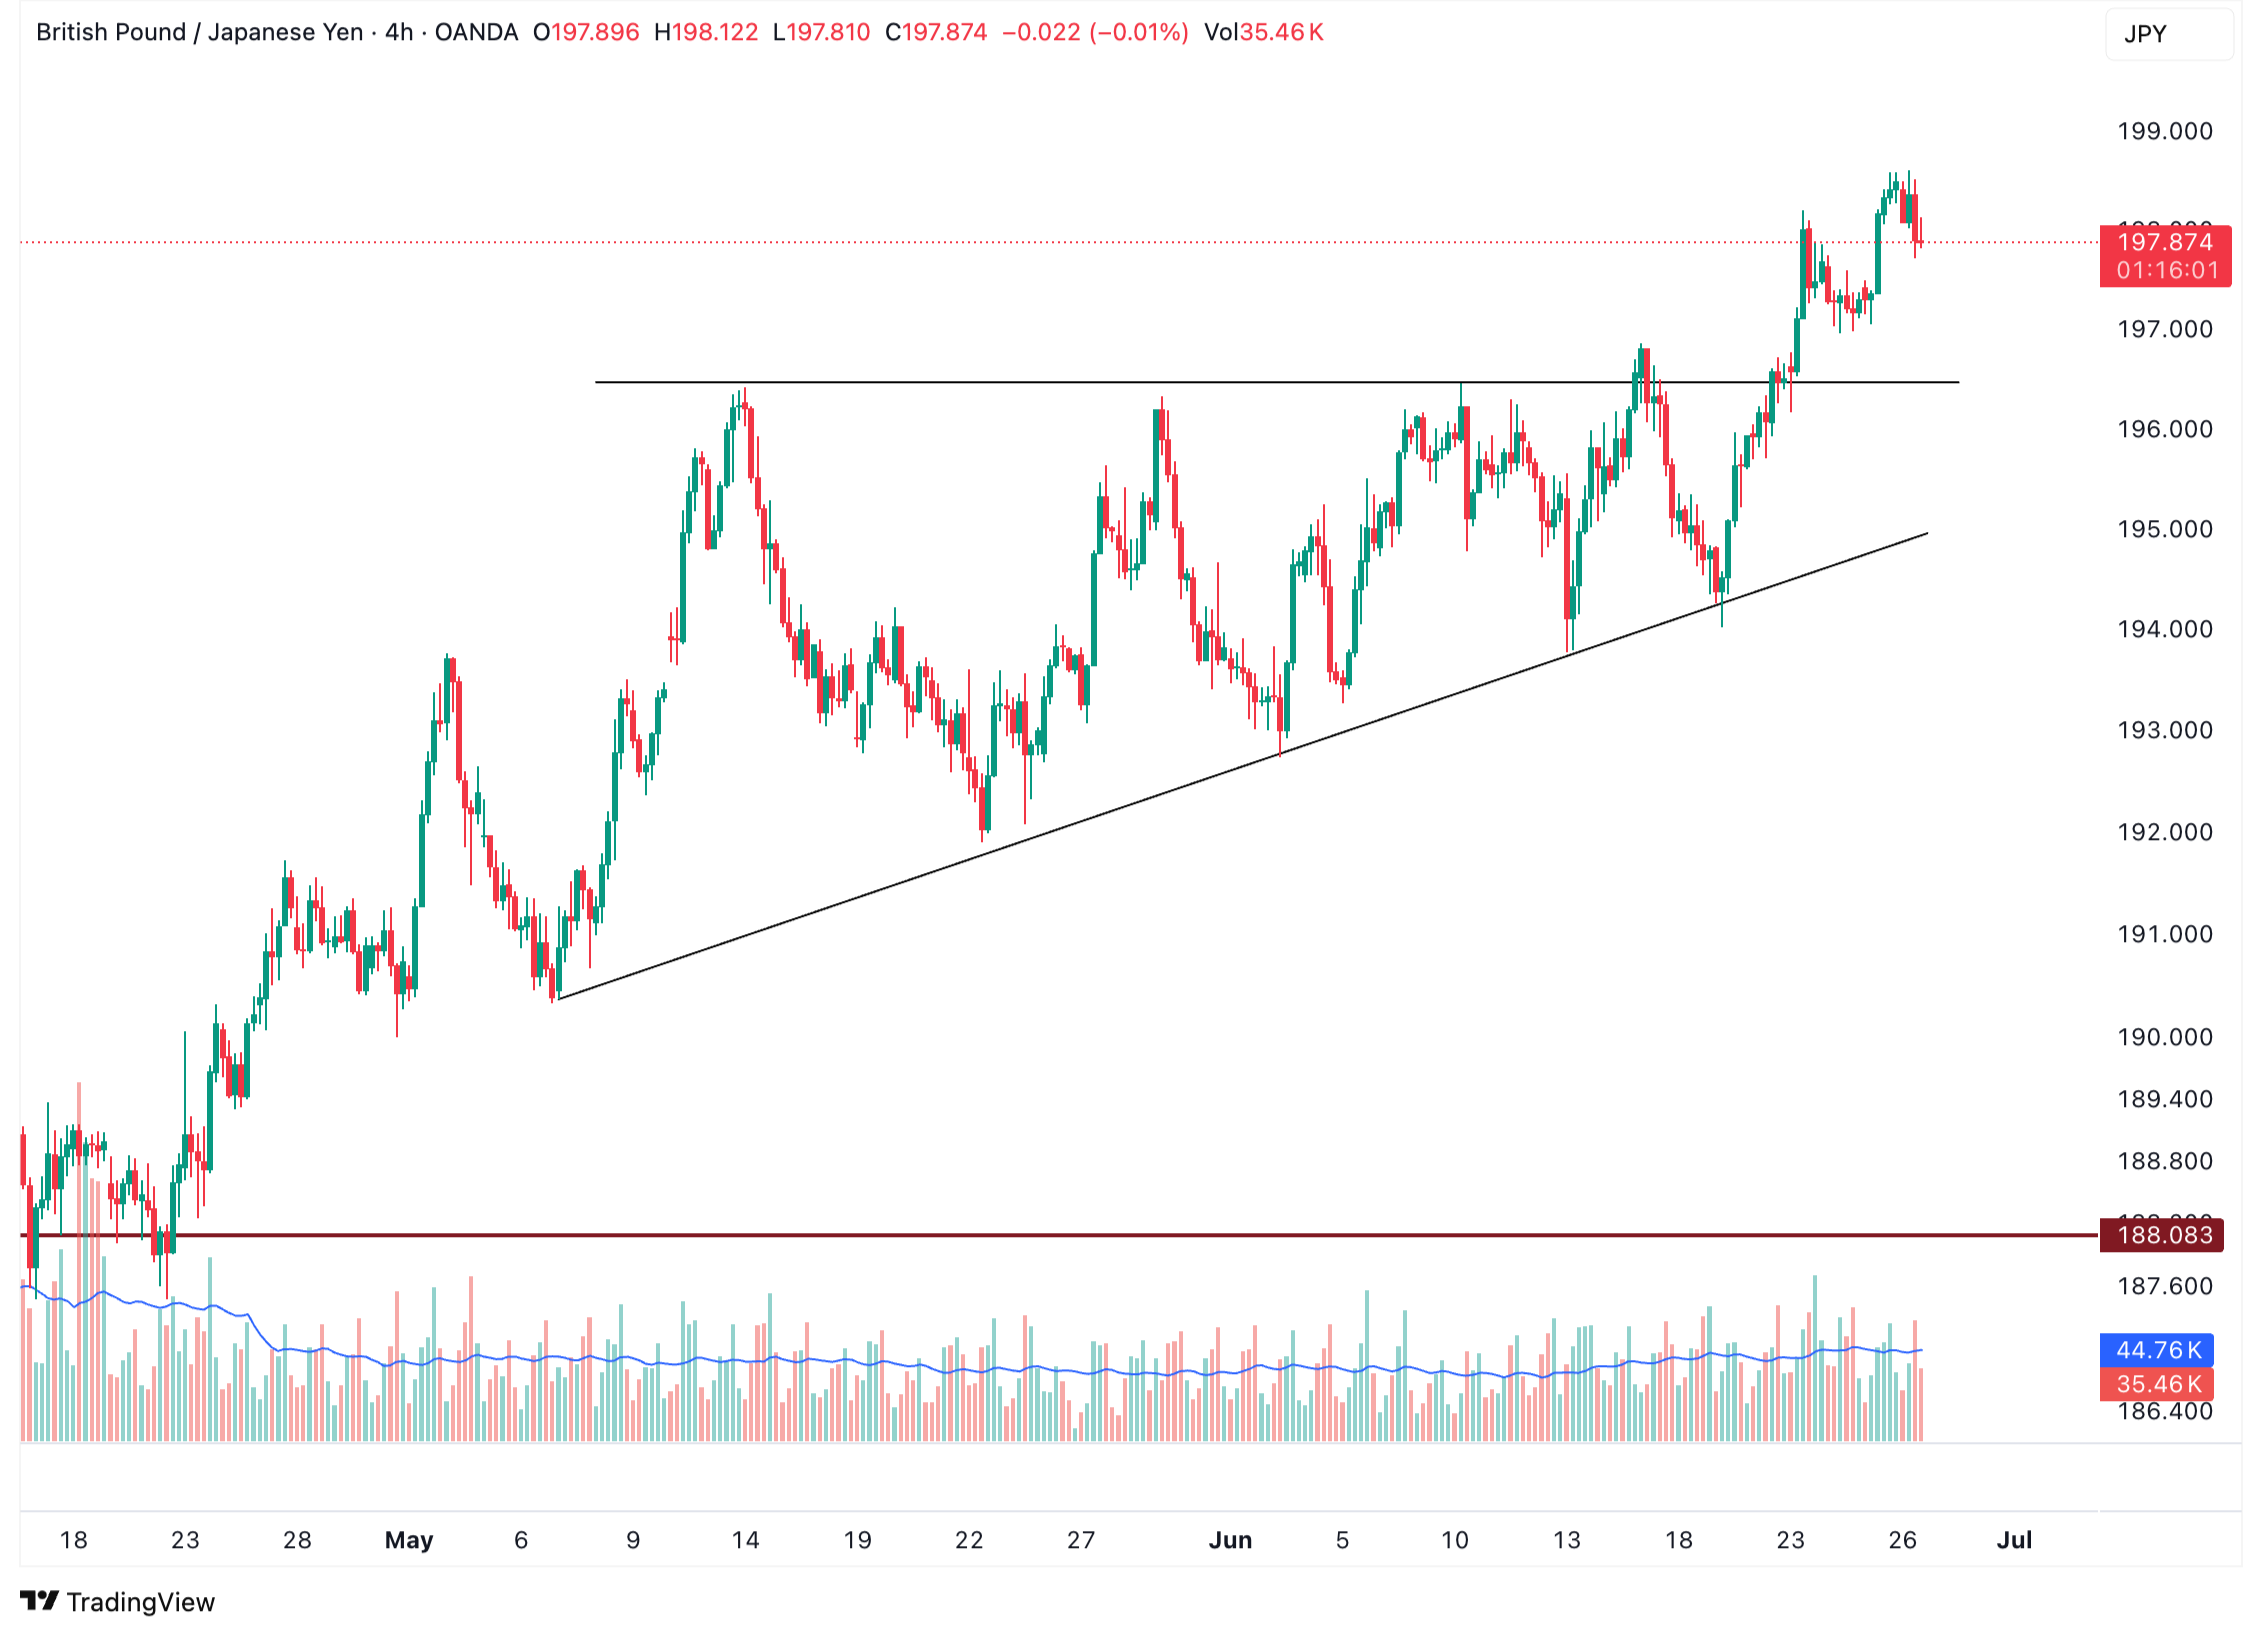
Conclusion
This multi-asset technical analysis illustrates how commodities, equity indices, and major forex pairs are aligned around critical zones. With upcoming macroeconomic data and central bank commentary expected, traders should be prepared for breakout validation or possible trend exhaustion depending on how price reacts to support and resistance levels.


Leave A Comment