


This multi-asset technical outlook highlights the current market structures across forex, crypto, and commodities. From bearish trends in the U.S. Dollar Index and Coffee to bullish setups in EUR/USD and corrective moves in SOL/USDT, traders face diverse opportunities and risks.
Multi-Asset Technical Outlook: U.S. Dollar Index (DXY)
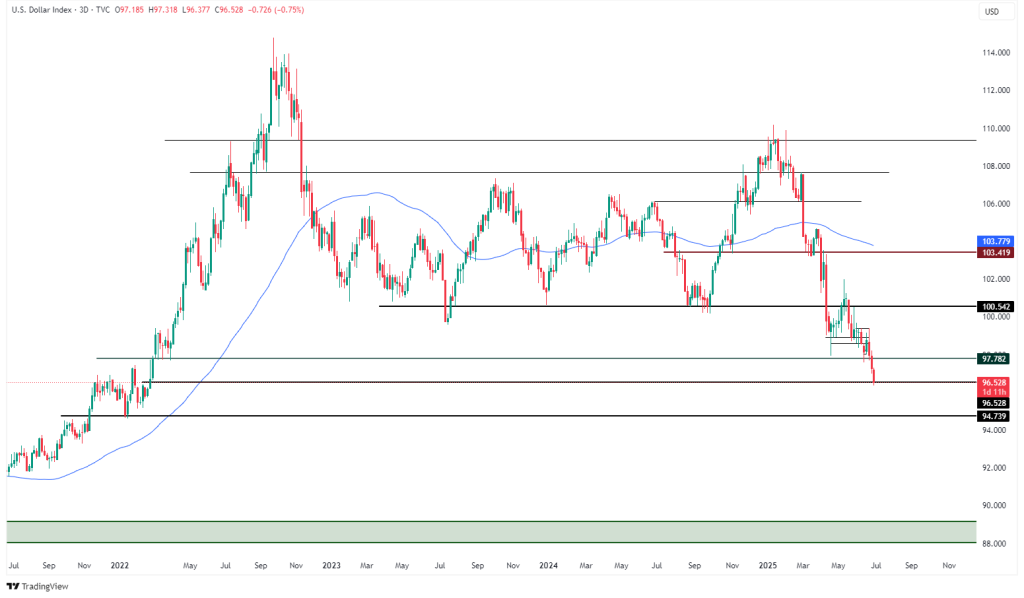
DXY continues its breakdown from a broader distribution phase. A recent close below 97.78 horizontal support signals further bearish continuation, with the next key level at 94.74 and potential room toward the 88–90 range if momentum persists. Sustained trading below the 200-day moving average confirms longer-term weakness and reinforces the bearish structure.
DXY continues its breakdown from a broader distribution phase.
- Breakdown Confirmation: Recent close below 97.78 horizontal support signals further bearish continuation.
- Support Below: Next key level at 94.74, with potential room toward 88–90 range if bearish momentum persists.
- Bearish Structure: Sustained trading below the 200-day MA confirms longer-term weakness.
SOL/USDT: Testing Critical Resistance
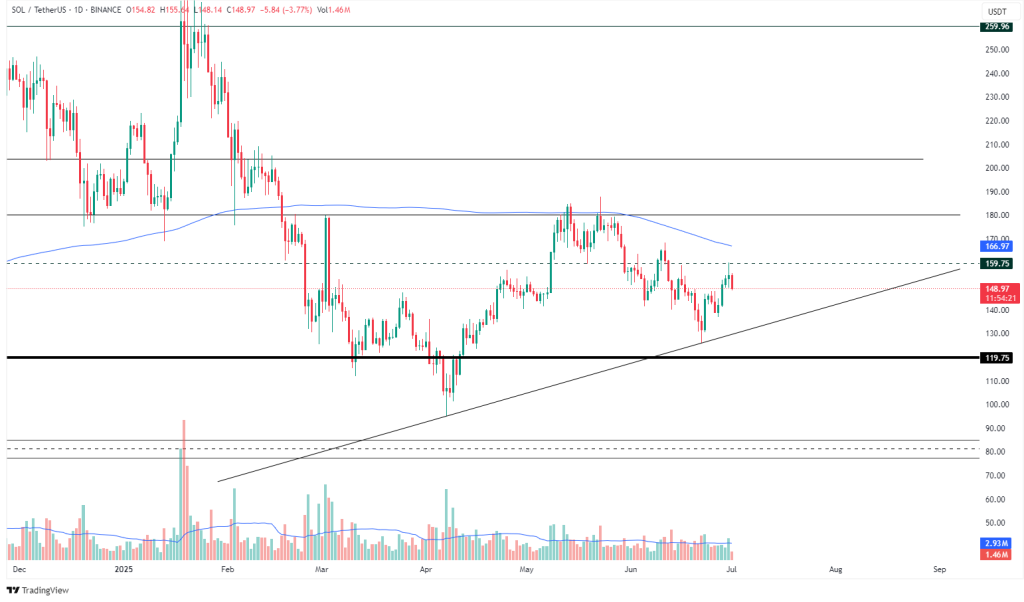
The chart for SOL/USDT shows a corrective upward movement testing key resistance areas after a prior downtrend.
- Trendline & Ascending Structure: Price action is supported by a medium-term ascending trendline, suggesting buyers are gradually stepping in on higher lows.
- Resistance Zones: The immediate resistance sits at ~$159.75 followed by the more critical $166.97 level (also coinciding with the 200-day MA), which has acted as dynamic resistance.
- Key Support: The horizontal level at $119.75 is a crucial demand zone; if violated, bearish continuation may accelerate.
EUR/USD: Bullish Channel Structure
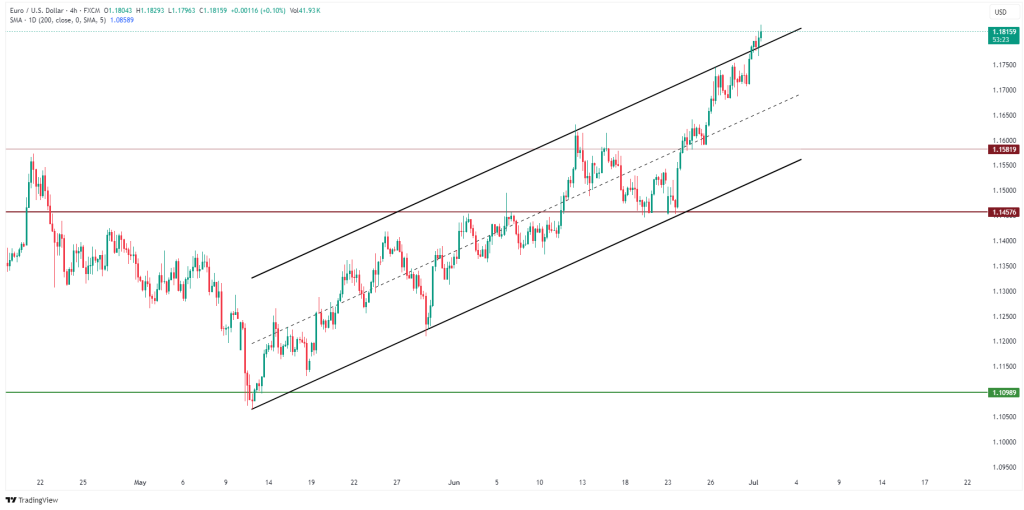
The EUR/USD pair is in a strong upward channel with clear bullish momentum.
- Ascending Channel: Price is respecting both boundaries of the rising channel. It is currently near the upper trendline, which often acts as short-term resistance.
- Key Support Levels: Horizontal support at 1.1581 and 1.1457 could serve as pullback targets if a correction occurs.
- Momentum: Sustained movement above the midline suggests strong underlying bullish pressure.
Multi-Asset Technical Outlook: Coffee Futures Bearish Setup
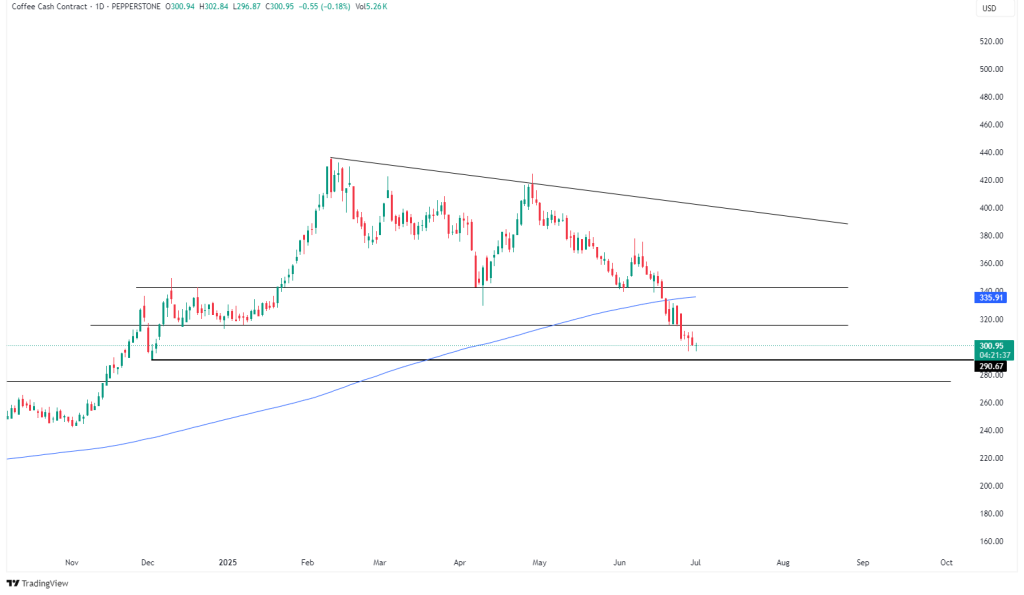
Coffee shows a clear downtrend with the price breaking below key horizontal support.
- Downtrend Structure: Series of lower highs and lower lows remain intact, with descending resistance lines overhead.
- Support Zones: Price is currently testing the ~$290.67 support. If broken, next demand zone lies lower.
- Bearish Pressure: Price is below the 200-day MA, confirming broader bearish sentiment.


Leave A Comment