


In this multi-asset technical analysis, we explore key chart setups across major markets: EURUSD, Brent crude oil, S&P 500 futures (ES1!), and the TOTAL crypto market cap. From rising wedges to bullish triangles, this breakdown highlights potential breakout zones, bearish signals, and the most relevant momentum indicators driving each asset.
Multi-Asset Technical Analysis: EURUSD Channel Setup
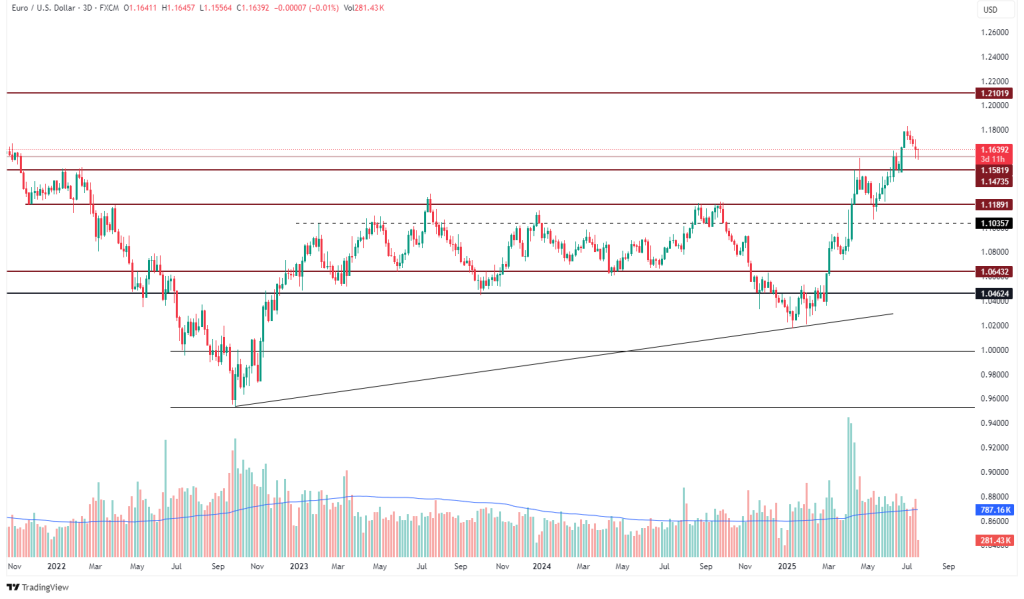
The EURUSD chart reflects a strong upward channel, with price action respecting both upper and lower boundaries consistently. The most recent candles indicate hesitation near the upper channel resistance, suggesting a potential pullback or breakout scenario.
If the price breaks above the upper boundary with momentum, it would invalidate the short-term bearish divergence seen on the RSI. Conversely, failure to break out and a drop below the midline of the channel would suggest a retest of the lower trendline support.
Key Indicator: RSI is currently in the overbought region. A bearish divergence is forming, which could precede a short-term correction.
Brent Oil in Multi-Asset Technical Analysis: Triangle Pattern Watch
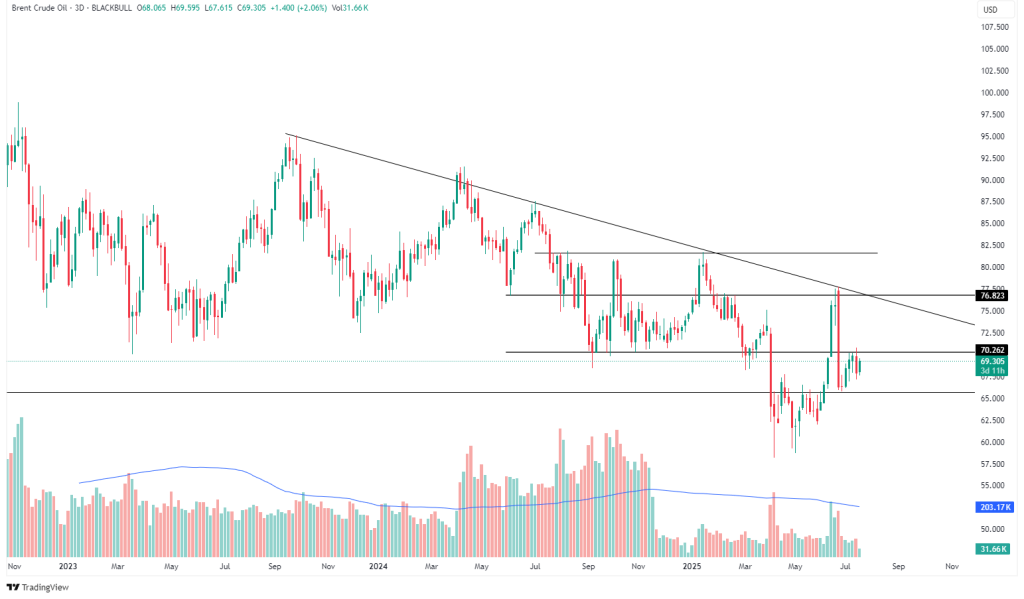
BRENT crude oil shows a symmetrical triangle pattern, a typical continuation setup. Price is squeezing tighter between converging trendlines, and a breakout seems imminent. Given the broader trend is bullish, probability favors an upside breakout.
However, volume has been decreasing, indicating indecision in the market. A breakout accompanied by increased volume would confirm directional bias.
Key Indicator: MACD is flattening, implying loss of momentum, yet poised for a potential bullish crossover on breakout.
S&P 500 in Multi-Asset Technical Review: Rising Wedge Risk
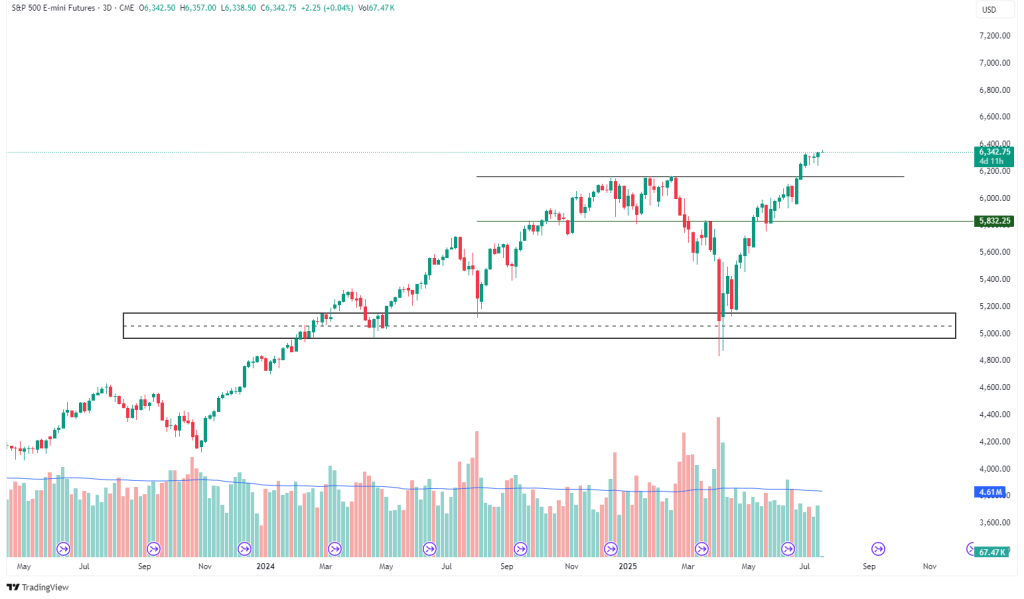
ES1! appears to be in a rising wedge, a bearish reversal pattern in an uptrend. The upper and lower boundaries are converging, and price has recently tagged the resistance line.
The most recent candles show upper wicks, implying buying exhaustion. If price breaks below the lower trendline, it would confirm the wedge and signal a potential drop toward the previous support zone.
Key Indicator: Stochastic is crossing down from overbought – a short-term reversal signal.
Crypto Total Market Cap in Focus: Ascending Triangle Signals
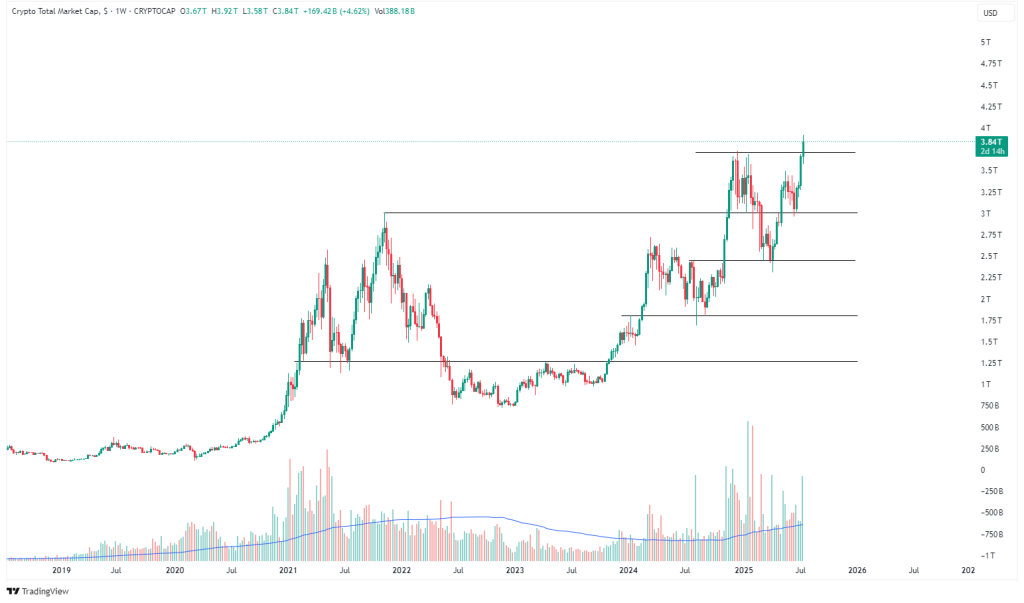
The TOTAL crypto market cap chart shows a horizontal resistance zone being tested repeatedly, forming a possible ascending triangle. This is a bullish continuation pattern, especially in uptrends.
Repeated rejections at the resistance may seem concerning, but each higher low increases bullish pressure. If price breaks above the horizontal ceiling, it could signal a market-wide bullish breakout.
Key Indicator: OBV (On-Balance Volume) is trending higher, indicating accumulation even during consolidation.


Leave A Comment