


In this week’s technical analysis update, we explore key price developments across major markets including EURUSD, Gold, Solana (SOL), and Alphabet Inc. (GOOG). As traders navigate shifting momentum and critical levels, this analysis highlights potential breakout zones, support retests, and reversal signals across forex, crypto, commodities, and tech equities.
Alphabet Inc. (GOOG): Key Resistance Holds the Trend in Check
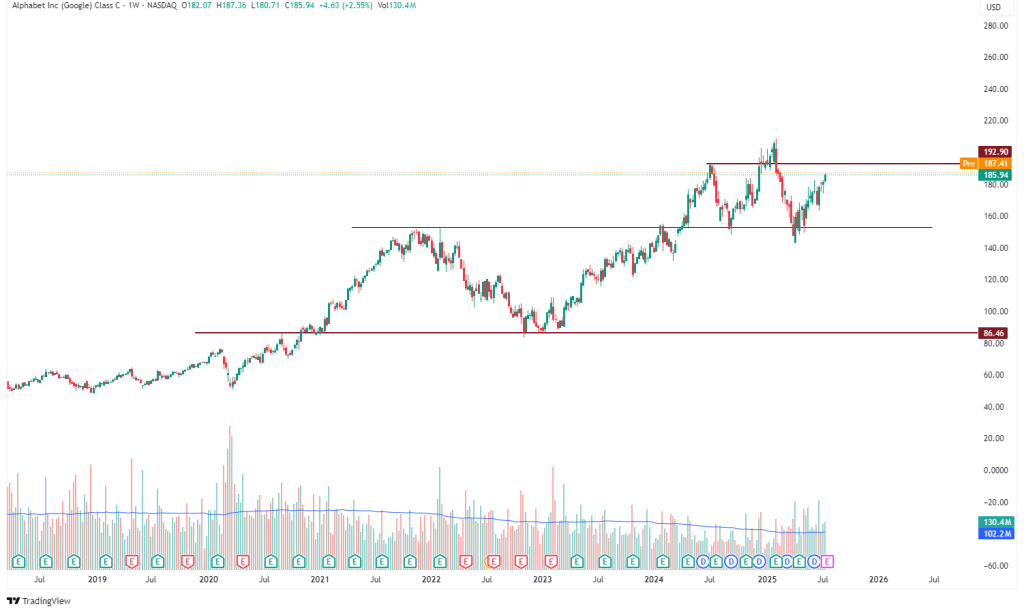
GOOG is currently testing the critical resistance level at 192.90, which has acted as a major rejection point twice in the past. The stock has recovered impressively from the 160 zone, creating a clear higher low structure.
If the price breaks and closes above 192.90 with volume, this could signal a major bullish breakout, potentially opening the path toward all-time highs above $210. However, if it fails here once again, a pullback toward 165–160 is highly likely, as this region served as a base for the previous move.
Volume trend is relatively steady, though a breakout would require above-average participation to be sustainable.
Gold Spot (XAUUSD): Bullish Structure Builds Toward Breakout
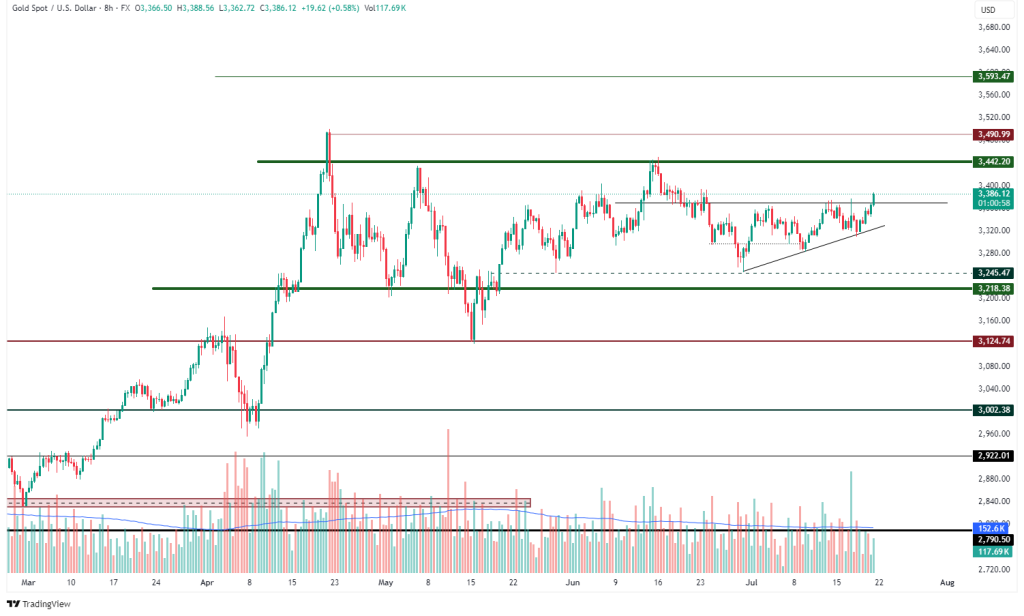
Gold continues to range between 3,245 and 3,442, but the recent price action shows higher lows forming, suggesting pressure is building beneath resistance. An ascending triangle structure is visible on the chart, hinting at a possible bullish breakout.
- Immediate resistance sits at 3,442.20, followed by 3,490.99.
- A confirmed breakout above this region could push prices to 3,593.
- On the downside, 3,245 is the first support, followed by 3,218. A breakdown here could trigger a test of the 3,124 zone.
Watch for volume expansion on breakout attempts, as declining volume could lead to false breakouts.
Solana Technical Analysis: Breakout Targets Higher Levels
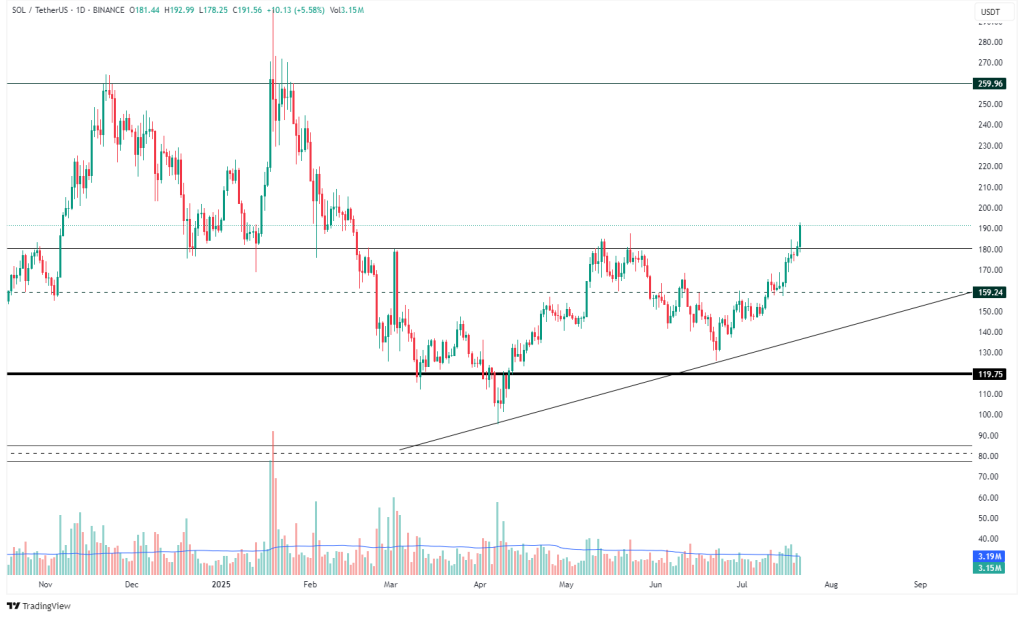
SOL has surged above the key resistance at 180, now trading around 191.56, marking a strong bullish breakout. This move also breaks the previous swing high, suggesting continuation potential.
- Next major resistance lies at 259.96, a zone where price was heavily rejected in the past.
- The breakout came with a strong bullish candle and increased volume—a positive sign.
- As long as SOL holds above 159.24, bulls remain in control. A retest of this level would be healthy consolidation.
The trendline from April continues to hold, indicating a well-supported move.
EURUSD Technical Analysis: Momentum Slows Near Resistance
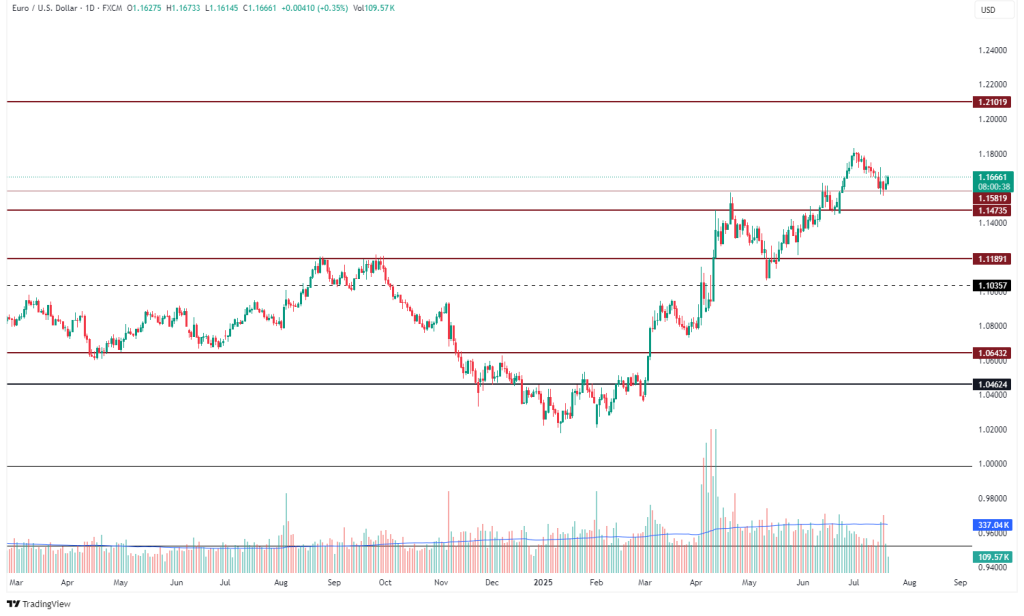
EURUSD is retracing slightly after testing the 1.18 region, which is acting as intermediate resistance. The recent surge above 1.147 and 1.158 turned these into strong support zones.
- If the pair stays above 1.158, the uptrend remains intact.
- A breakout above 1.18 could target 1.21, the next major resistance.
- If price fails and dips back below 1.147, a deeper correction toward 1.12 could be on the table.
The trend remains bullish overall, but this region is critical to determine if momentum can continue.


Leave A Comment