

This technical analysis update highlights key market movements across USDJPY, Bitcoin, Copper, and Gold. We break down resistance and support levels, volume dynamics, and breakout potential. Traders can use these insights to navigate short-term volatility while keeping an eye on broader trend signals.
Technical Analysis Update: USDJPY in a Descending Triangle
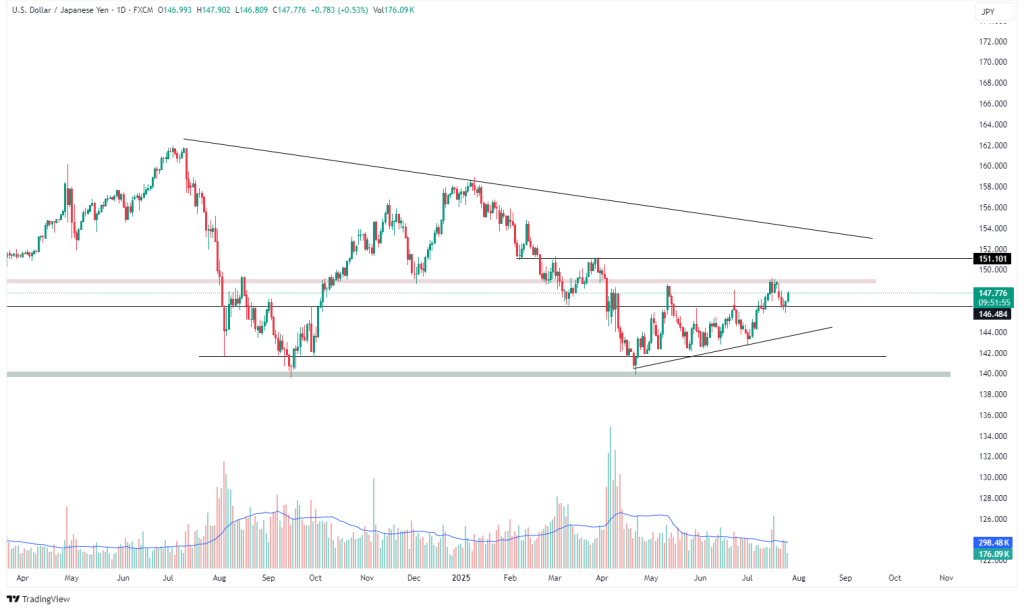
USDJPY continues to trade within a long-term descending triangle structure, respecting both horizontal resistance near 151.10 and lower highs forming a contracting price action. After a recent rally from the 140.00 region, the price has once again tested the resistance zone between 148.00 and 149.00, but failed to sustain a breakout, leading to a short-term pullback.
The support line around 146.50 is currently being retested. A break below this level could lead to a revisit of the 144.00-143.00 zone, aligned with the ascending trendline that has supported the pair since early May. Volume remains relatively stable, showing no strong bullish conviction near resistance.
This chart reflects a rising wedge formation, often considered bearish, especially within a larger bearish structure.
Technical Analysis Update: Bitcoin Faces Heavy Resistance
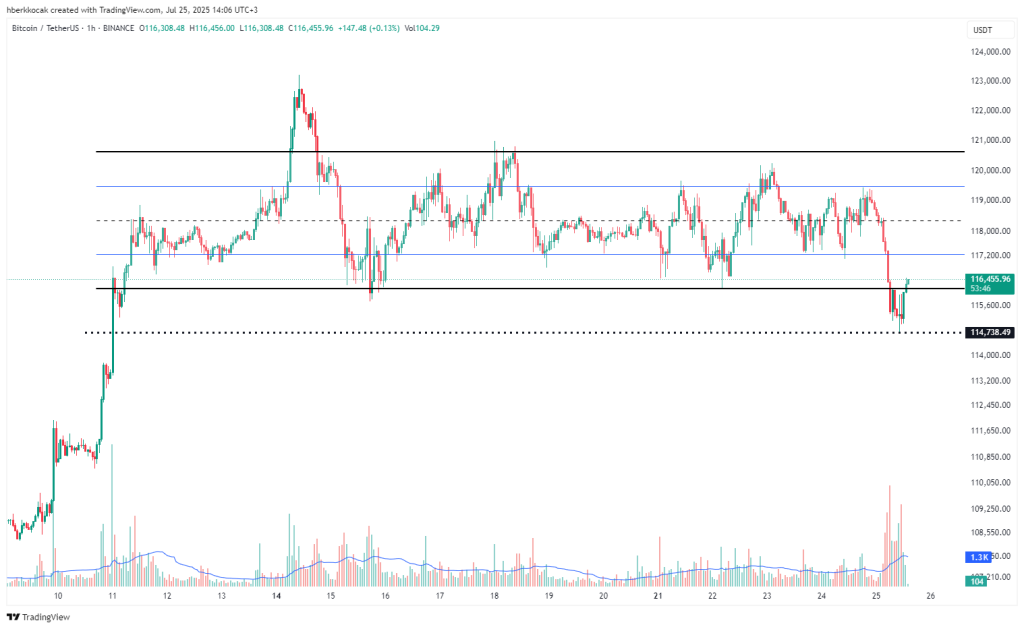
Bitcoin saw a sharp rejection from the 120,000 USDT region, collapsing toward the horizontal support at 114,738, which held firm on the first test. This support has acted as a demand zone multiple times, and price has once again reacted positively with a short-term bounce.
Currently, BTC is trying to reclaim the mid-range of the horizontal channel, but volatility is elevated, and volume has surged, especially on the recent dip—indicating possible accumulation at the lows.
A clean move above 117,200 would be needed to reestablish bullish control. Otherwise, a break of 114,738 could lead to a steeper correction toward 112,000 and below.
Copper Breaks Above Long-Term Channel
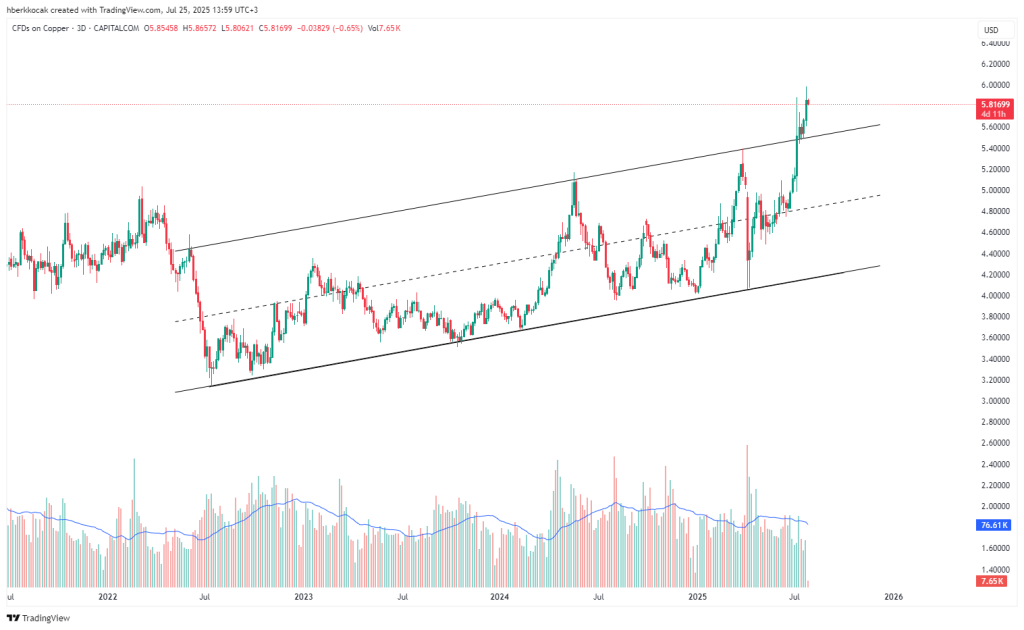
Copper has broken above the upper boundary of a multi-year ascending channel, signaling strong bullish momentum. This breakout follows multiple clean touches to both the lower and mid-channel levels, which historically acted as dynamic support/resistance.
The breakout level near 5.60 now becomes critical support, and the recent candle closes above 5.80 suggest continuation toward 6.00 psychological resistance and possibly beyond.
The price expansion is supported by consistent volume, though slightly tapering—a consolidation above 5.60 would reinforce the strength of the breakout. Failure to hold this zone could mean a return into the channel, invalidating the breakout.
Gold Consolidates Near Resistance
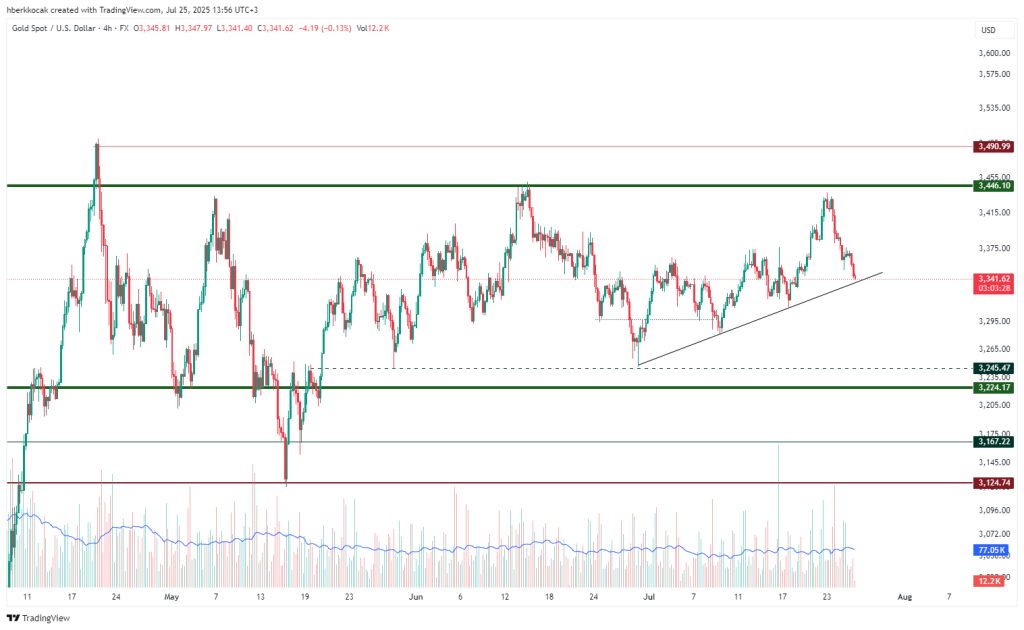
Gold remains within a broad consolidation zone, with 3,446 acting as firm horizontal resistance. After a double rejection near this level, the price is currently testing a rising trendline support around 3,340.
Should this level break, the next supports to watch lie at 3,245 and 3,224, marking previous demand zones. A breakdown from the current trendline could trigger a short-term bearish continuation, whereas a bounce would confirm the upward channel.
Volume remains stable, with no significant breakout moves, implying traders are awaiting direction confirmation.


Leave A Comment