

EURUSD
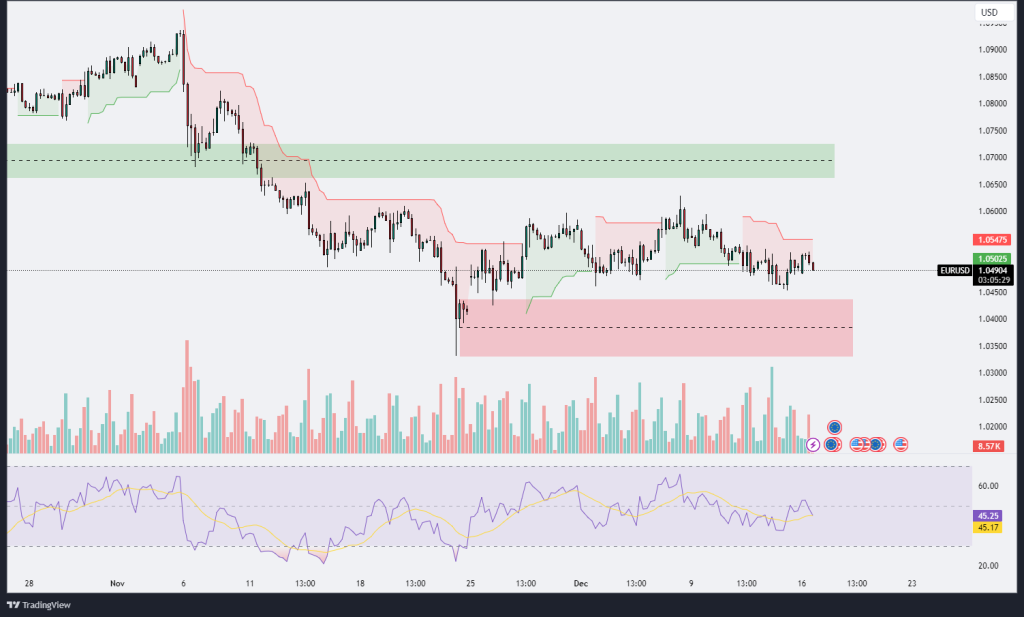
The EUR/USD chart is showing a prolonged period of sideways consolidation between the 1.05475 resistance and the 1.04500 support level. The price has been unable to decisively break out of this range, suggesting indecision and a balance between buyers and sellers. The Ichimoku cloud highlights a bearish bias as the price remains below the cloud with a thin red upper boundary, acting as short-term resistance. This indicates that the bearish momentum from the sharp decline in late November remains in play, albeit weaker, as the price hovers near the lower boundary of the range.
Volume analysis shows a declining trend, with spikes during key lows, indicating buyers are attempting to defend the 1.04500 level, but their efforts lack strong follow-through. A break below this level would likely trigger further downside movement toward the highlighted support zone near 1.04000. Conversely, if the price manages to push above 1.05475 with a convincing surge in volume, the next significant resistance lies in the green zone around 1.07000.
The RSI currently sits at 45.17, reflecting a neutral to slightly bearish condition, as it struggles to sustain a move above the 50 midpoint. The RSI’s flattening trajectory mirrors the range-bound nature of the price action, indicating a lack of strong momentum in either direction. If RSI drops further, it could confirm a bearish continuation.
In summary, the EUR/USD pair remains trapped in a tight range, with clear support at 1.04500 and resistance at 1.05475. Traders should watch for a breakout from this range, as it will likely dictate the pair’s next major move. A breakdown below support could lead to a continuation of the broader bearish trend, while a breakout above resistance could signal the start of a reversal. Volume confirmation and RSI direction will be critical in validating the breakout or breakdown.
GBPUSD
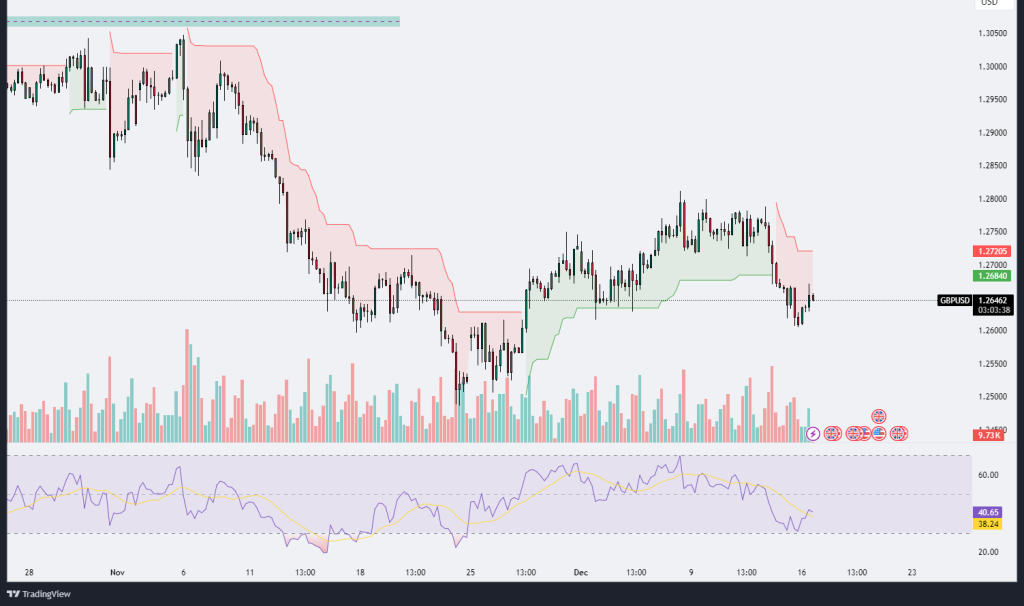
The GBP/USD chart displays a recent shift in momentum as the price experiences a retracement after a notable uptrend earlier in December. The price is currently testing the 1.26462 area after a sharp decline from the 1.27205 resistance level, which coincides with the upper Ichimoku cloud boundary. This drop highlights a bearish correction following the bullish run that started in late November. The Ichimoku cloud, now turning red and widening, signals the potential for further downside pressure as price trades below the cloud.
Volume analysis shows a noticeable uptick during the recent decline, indicating selling pressure as traders locked in gains from the earlier rally. The failure to sustain above the 1.27000 level confirms that sellers currently hold short-term control. If the price fails to regain ground above 1.27000, the next significant support to watch lies near 1.26000, a psychological level and prior consolidation zone. A break below this support would suggest a continuation of the bearish correction toward 1.25500.
The RSI is currently at 38.24, reflecting a bearish momentum and indicating that the pair is approaching oversold conditions. The RSI’s recent trajectory shows a downward slope, signaling weakening buying strength. Traders should monitor whether the RSI remains below the 40 level, as this could confirm the prevailing bearish bias. However, if RSI rebounds, it may hint at a short-term reversal or consolidation.
In summary, GBP/USD is showing signs of short-term weakness following rejection from the 1.27205 resistance level. The bearish crossover of price and the Ichimoku cloud reinforces the downside bias. The 1.26000 support zone will be critical; a failure to hold this level could accelerate the decline toward lower supports. Conversely, any bullish reaction would require a decisive move back above 1.27000 to negate the bearish momentum. Volume and RSI behavior will play a key role in confirming the pair’s next directional move.
XAUUSD
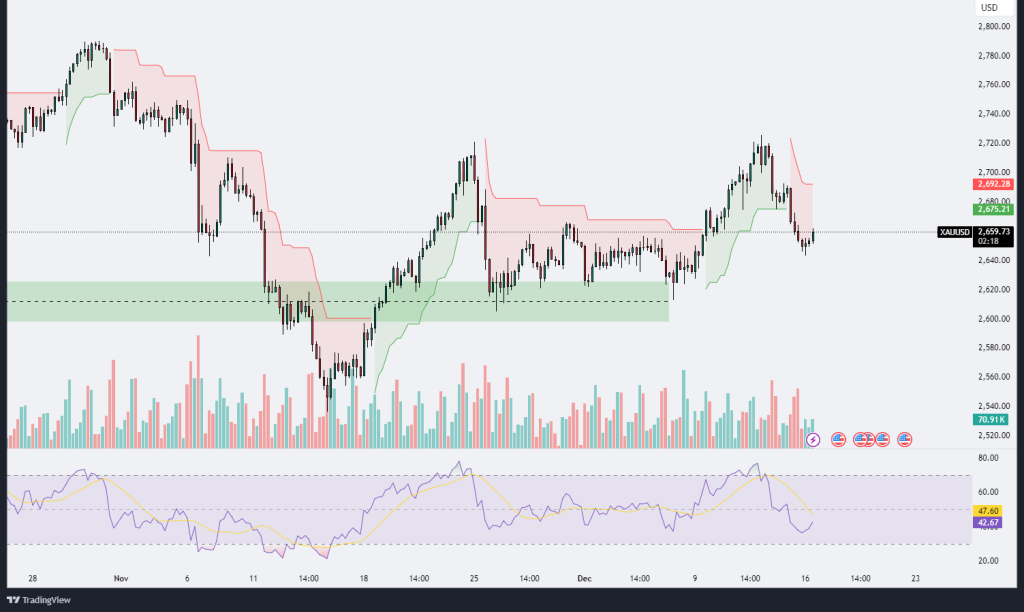
The XAU/USD chart (Gold priced in USD) presents a clear technical shift after a notable bullish rally followed by a sharp correction. The price action is currently consolidating around 2,659.72, testing key levels following its rejection near 2,692.28, which aligns with a short-term resistance zone. After the recent bullish breakout from a consolidation range (green zone), Gold peaked at 2,700 before sellers regained control, driving prices lower. This corrective move has coincided with the price breaching the lower boundary of the Ichimoku cloud, turning the cloud red and signaling a potential bearish phase.
The Ichimoku cloud shows a flattening structure, reflecting indecisiveness and increasing consolidation pressure. If the price remains below the cloud and fails to regain momentum above 2,675, sellers might attempt to retest support near 2,620, an area of prior accumulation and buying interest. This zone also overlaps with previous consolidation, making it a critical level for a potential bullish rebound. A breakdown below this support would signal further downside, with the next key level near 2,580.
Volume analysis highlights growing selling pressure during the recent correction, as evidenced by the increasing red bars. However, the latest session shows a slight decrease in volume, suggesting a possible slowdown in bearish momentum. For bulls to regain control, buyers must defend the 2,650–2,675 area and push prices decisively above the resistance zone at 2,692.
The Relative Strength Index (RSI) currently sits at 42.67, reflecting bearish momentum and a lack of buying strength. The RSI recently dipped below the midline (50), signaling increased selling pressure, but it remains above oversold conditions. If RSI fails to reclaim the 50 level, it may confirm bearish continuation. On the other hand, a rebound above 50 could signal a shift toward bullish recovery.
In conclusion, XAU/USD faces critical technical tests after a sharp retracement from its highs. The 2,675 resistance acts as a short-term pivot, while 2,620 serves as a major support level to watch. The price’s interaction with the Ichimoku cloud and RSI will be key in determining whether the current move is a temporary correction within a broader uptrend or the start of a more significant bearish phase. Traders should monitor volume closely and look for confirmation signals near these critical levels.
XAGUSD
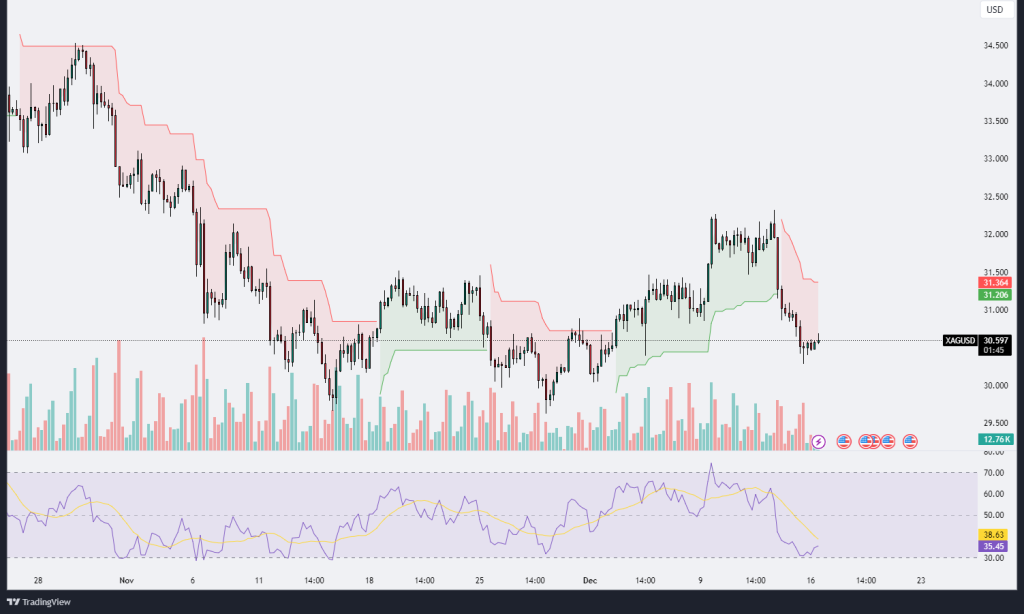
The XAG/USD (Silver priced in USD) chart displays a bearish momentum following a sharp decline, as indicated by the recent price movement and technical indicators. Silver is currently trading at 30.597, testing a key psychological support level near the 30.50–30.60 zone after a steep drop from the highs around 32.00. This decline is accompanied by significant selling pressure, visible through the increasing red volume bars over the past few sessions. The Ichimoku cloud highlights a bearish shift, with the price firmly below the red cloud and signaling short-term resistance around 31.20.
The Ichimoku cloud previously supported the price during its bullish rally earlier in December, but the cloud has since turned bearish, reflecting growing selling sentiment. The steep rejection near 32.00 has triggered profit-taking and pushed the price into a corrective phase. If the price fails to hold above the 30.50 level, a further drop toward the 30.00 psychological support could occur. Conversely, a rebound above 31.20 would be required for bulls to regain momentum and challenge the resistance near 32.00.
Volume analysis confirms bearish dominance as volume spikes on red candles reflect increased participation by sellers. This suggests that bears remain in control for now, and any upward movement would need strong buying volume to offset the recent downward trend.
The Relative Strength Index (RSI) is currently at 35.45, approaching oversold territory. This indicates that selling pressure may be reaching exhaustion, and a short-term rebound could occur if buyers step in to defend the 30.50 support. However, the RSI remains below the midline (50), confirming the overall bearish momentum. Traders should closely monitor RSI behavior; a move back above 40 could signal a potential reversal, while a continued drop below 30 would suggest further downside risk.
In summary, XAG/USD is at a critical juncture, testing key support near 30.50 following a sharp bearish correction. The Ichimoku cloud and RSI both confirm bearish momentum, while volume data highlights strong selling pressure. Bulls will need to reclaim 31.20 to reverse the trend, while failure to hold the current support could lead to further declines toward the 30.00 level. Traders should watch for any bounce signals near the support area and observe volume behavior for confirmation of a potential reversal.


Leave A Comment