

EURUSD
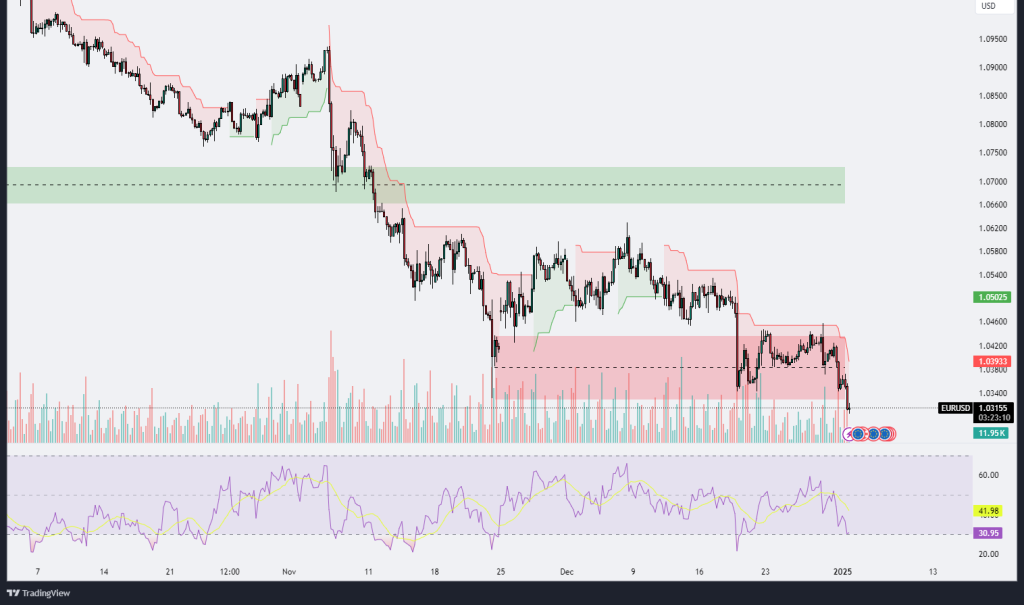
The EUR/USD chart exhibits a strongly bearish trend, with the price breaking below the significant support level at 1.0393, as indicated by the red zone. This breakdown is accompanied by increased trading volume, suggesting that sellers are dominating the market. The Ichimoku cloud analysis reinforces the bearish sentiment, with the price well below the cloud and both the Tenkan-sen and Kijun-sen lines sloping downward. This configuration highlights a continuation of the downward momentum.
The RSI indicators at the bottom of the chart show oversold conditions across multiple timeframes, currently hovering near 30.17. While this could indicate potential for a short-term relief rally or consolidation, it also reflects the intensity of selling pressure in the market. Despite the oversold RSI levels, the lack of bullish divergence implies that buyers are not stepping in with enough force to counteract the bearish momentum.
If the price continues to decline, the next significant support level lies closer to the 1.0300 psychological mark or potentially lower, around 1.0250, which could act as a critical floor for the pair. Conversely, for a reversal or relief rally to materialize, the price would need to reclaim the 1.0393 level, with further resistance at 1.0480 and the upper boundary of the cloud at 1.0500. Overall, the market remains heavily tilted in favor of the bears, and traders should approach any bullish setups with caution, as the trend is decisively downward.
GBPUSD
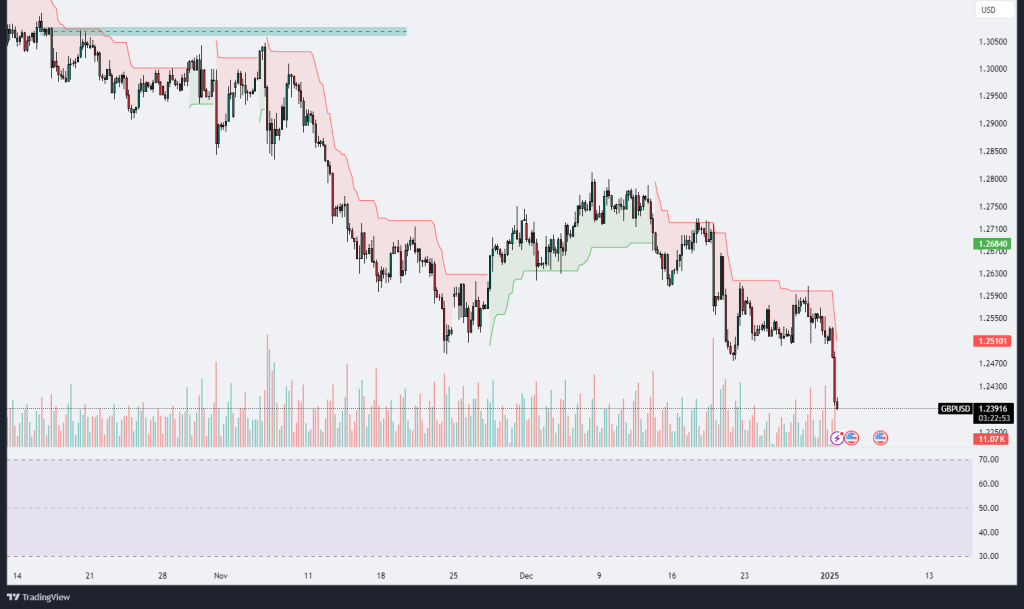
The GBP/USD chart illustrates a pronounced bearish trend, with the price breaking below a significant support level at 1.2510, now trading near 1.2391. This breakdown is characterized by a sharp increase in bearish volume, signaling strong selling pressure. The Ichimoku cloud setup further underscores the bearish outlook, as the price is decisively trading below the cloud with no immediate signs of a reversal. The red zone above indicates resistance levels that the price is unlikely to test in the short term unless a significant reversal occurs.
The RSI indicator on the chart has dipped into oversold territory, registering at 25.17. This suggests that the market is oversold and might be due for a potential short-term corrective bounce or consolidation. However, the lack of bullish divergence on the RSI diminishes the likelihood of a strong reversal at this stage. Traders should also note the steep downward slope of the moving averages within the RSI, which confirms sustained bearish momentum.
If the downward trajectory continues, the next support level could be found near the 1.2300 psychological mark, followed by 1.2250. For the bulls to regain control, the price would need to break back above 1.2510 and then target 1.2600, a previous resistance zone. The current sentiment remains overwhelmingly bearish, and any recovery attempts are likely to face significant resistance due to the strength of the ongoing downtrend. Caution is advised for traders attempting to counter-trend trade in such a strongly bearish market environment.
XAUUSD
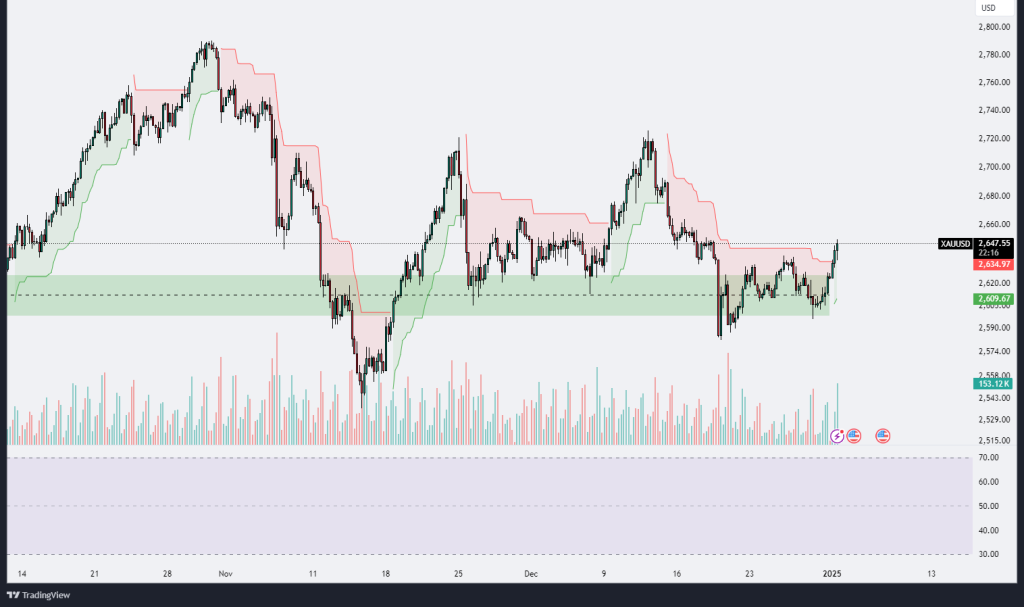
The XAU/USD (Gold vs. US Dollar) chart demonstrates a clear bullish recovery from a significant support zone around $2,610, with the price currently trading near $2,647. This recovery comes after a consolidation phase within the green highlighted demand zone, which previously acted as a strong area of support. The Ichimoku cloud analysis shows the price has successfully breached the cloud, signaling a potential bullish continuation. Additionally, the volume accompanying this upward move has noticeably increased, further confirming the bullish momentum.
The RSI indicator supports this bullish sentiment, currently at 69.17 and approaching overbought territory. This suggests strong upward momentum, though it also indicates a potential slowdown if the RSI enters deeply overbought levels. Traders should monitor for a possible pullback or consolidation near resistance levels around $2,650-$2,675, as the price may face selling pressure in this region. A sustained break above this zone would open the door for further upside towards the next resistance at $2,700.
On the downside, if the price fails to hold above the cloud or falls back into the demand zone, it could indicate a reversal or a period of consolidation. In such a scenario, $2,610 remains a critical support level to watch. Overall, the chart leans bullish, with key levels and RSI suggesting momentum is likely to remain in favor of buyers in the near term, provided no significant bearish reversal signals emerge.
XAGUSD
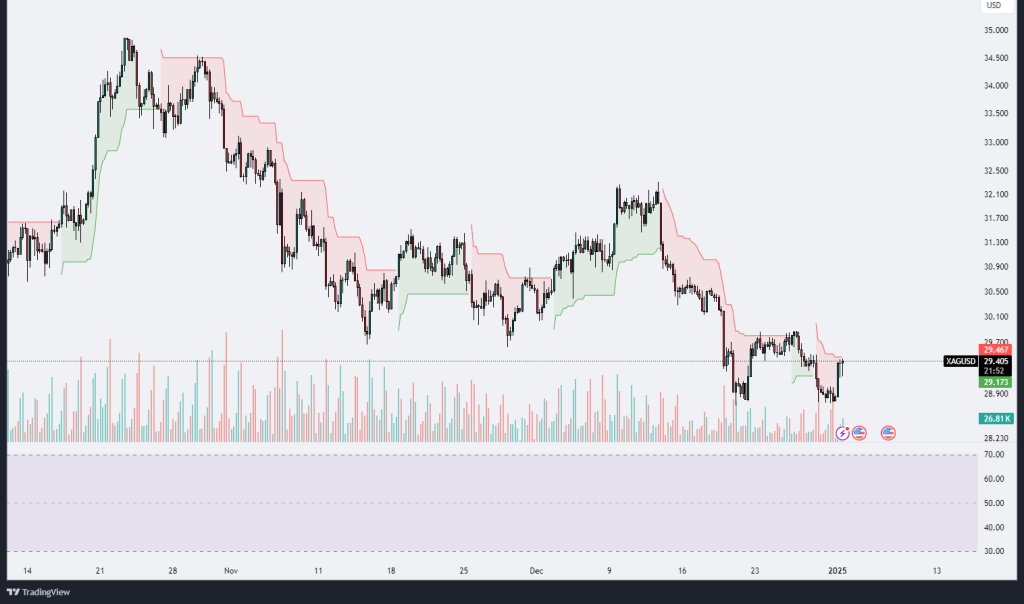
The XAG/USD (Silver vs. US Dollar) chart shows an ongoing recovery from a recent low near $28.90, with the price currently trading around $29.47. This upward movement comes after a steep decline throughout December, which saw the price break below multiple support levels. The recovery appears to be supported by an increase in trading volume, suggesting renewed buying interest at these levels. The Ichimoku cloud indicator highlights the current price action is still under a bearish cloud, meaning the overall trend remains bearish despite the short-term recovery.
The RSI indicator has climbed to 54.35, moving out of oversold territory. This signals a potential shift in momentum towards a bullish phase, although the RSI remains within a neutral range, leaving room for further upside without immediately entering overbought conditions. However, resistance around $29.70, which aligns with the lower boundary of the Ichimoku cloud, could pose a challenge for further price advances. A successful break above this level might attract more buyers and pave the way for a retest of the $30.50 level, a significant psychological and technical resistance.
On the flip side, if the price fails to sustain this recovery and turns lower, support near $29.00 could come into play again. A break below this support would reinforce the bearish trend and potentially lead to a retest of December lows around $28.70-$28.80. Traders should closely monitor volume and RSI behavior for confirmation of either continuation of the recovery or a reversal back into bearish territory. Overall, while the short-term outlook shows signs of stabilization, the broader trend remains bearish until key resistance levels are reclaimed.


Leave A Comment