

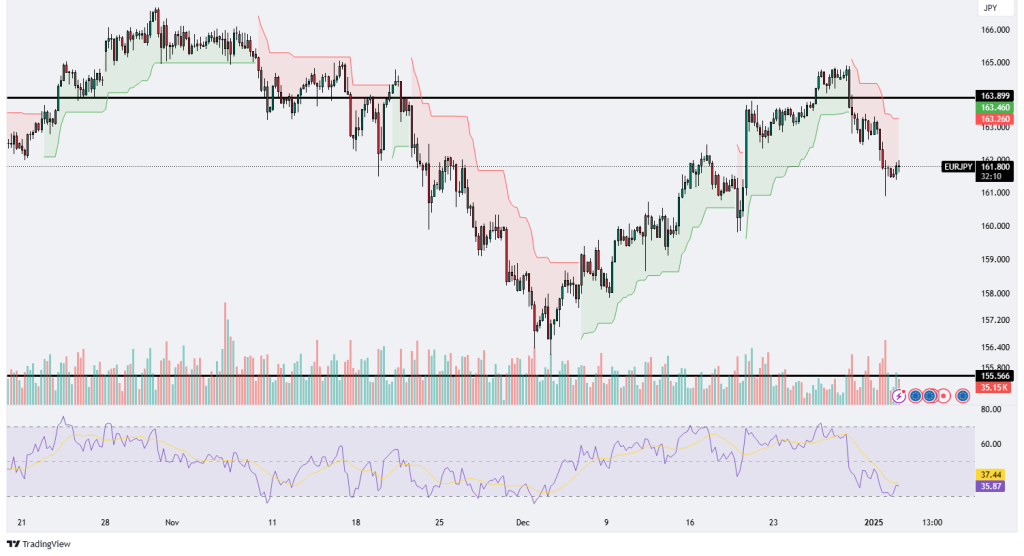
EURJPY
The EUR/JPY chart depicts a bearish retracement after the pair faced rejection from the 163.89 resistance level, as seen in the recent breakdown below the Ichimoku cloud. The price is currently trading near 161.78, showing signs of consolidation following a sharp decline. Volume has spiked during the decline, indicating significant selling pressure, but the price appears to be stabilizing as it approaches potential support near 161.00, a level that aligns with previous consolidation zones.
The RSI has dropped to 35.74, suggesting oversold conditions are approaching, which could signal a potential reversal or at least a pause in the downward movement. However, the RSI’s failure to cross back above 40 in recent attempts underscores the prevailing bearish sentiment. If the pair fails to sustain above the 161.00 level, further downside toward the key support at 155.57 could be expected. This level is critical, as it marks the base of previous bullish momentum from late November.
On the flip side, if buyers regain control and the price moves back above 163.00, it could signal the start of a recovery. The Ichimoku cloud serves as immediate resistance in the 162.80-163.00 range, and a successful breach above this zone would pave the way for a retest of the 163.89 resistance. Until then, the bias remains bearish with caution for a potential oversold bounce. Traders should closely watch volume dynamics and RSI behavior for confirmation of the next directional move.
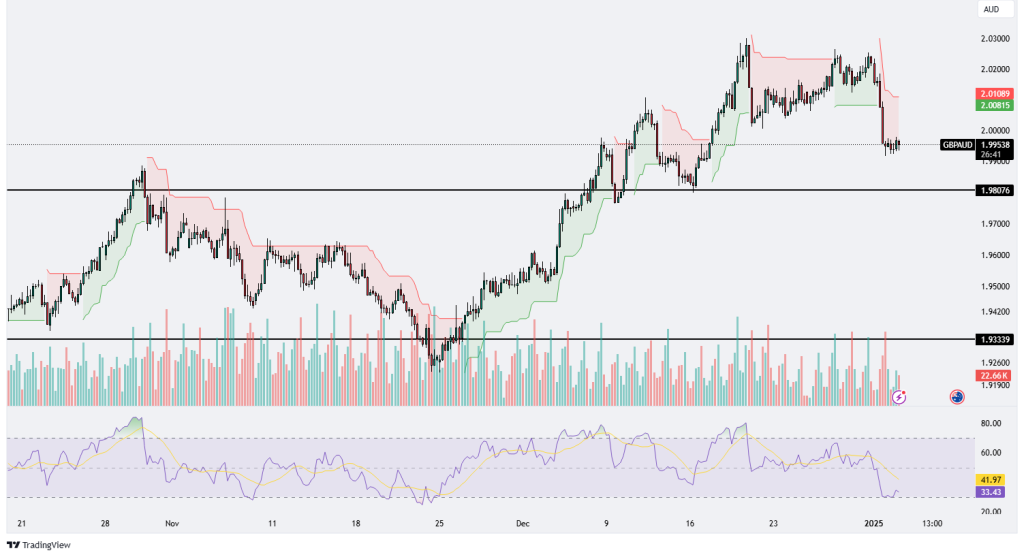
GBPAUD
The GBP/AUD chart highlights a bearish retracement after the pair encountered resistance near 2.0200, leading to a drop below the psychological level of 2.0100. The price is currently consolidating around the 1.9950 level, with potential support identified near 1.9807, a key horizontal level that acted as previous resistance in late November. The recent drop has been accompanied by increased volume, indicating heightened selling pressure as the pair loses momentum following its bullish breakout in early December.
The Ichimoku cloud indicator signals further downside risks as the price has decisively fallen below the cloud, indicating a shift to bearish sentiment. The RSI has dropped to 33.43, suggesting that the pair is approaching oversold conditions. However, with no clear signs of a reversal, the RSI’s position reflects continued bearish momentum, and traders should monitor it for potential divergence or recovery above 40 as an early indication of a bounce.
If the pair continues to decline, a break below 1.9807 could trigger further downside toward the next significant support near 1.9333. Conversely, if the pair stabilizes and rebounds, immediate resistance is likely near the 2.0100 level, which aligns with the lower edge of the Ichimoku cloud. A recovery above this zone would be needed to reignite bullish sentiment and target the December highs around 2.0200. Overall, the bearish bias remains dominant, but traders should remain vigilant for potential oversold corrections or trend shifts near key support levels.
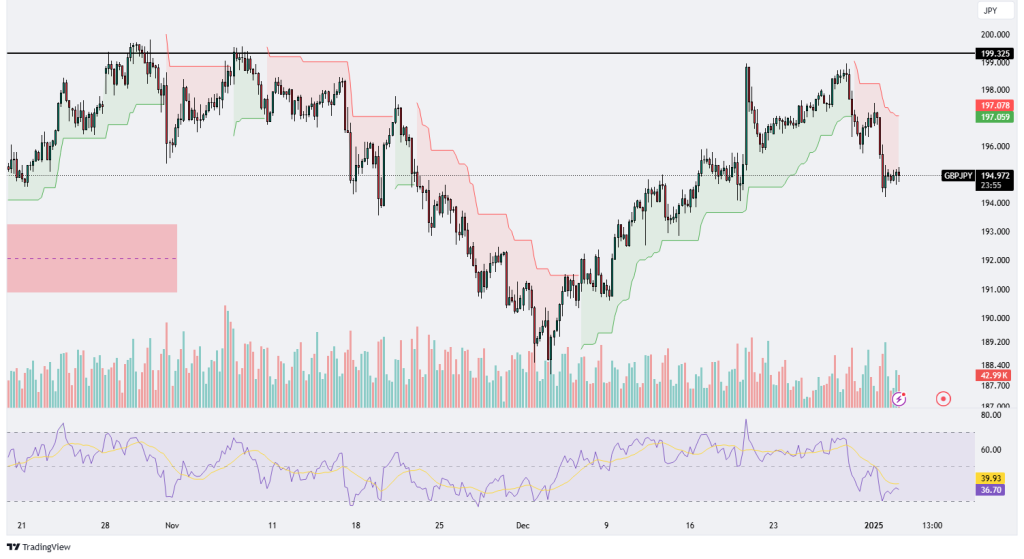
GBPJPY
The GBP/JPY chart demonstrates a bearish correction following its recent attempt to test the key resistance level at 199.325. After failing to breach this level decisively, the price retraced and is now trading near the 194.957 level, reflecting a loss of bullish momentum. The Ichimoku cloud indicator highlights a shift in sentiment, with the price now trading below the cloud, indicating potential downside risks. This bearish move has been accompanied by increased volume, suggesting strong selling pressure as market participants react to the rejection at the resistance level.
The RSI is currently at 36.59, indicating that the pair is nearing oversold conditions, which could potentially lead to a short-term bounce. However, the RSI trend remains bearish, and a further drop could signal continued downward movement. If the pair breaks below the 194.00 psychological support level, it could target the next significant support area around 192.00, where prior accumulation occurred.
Conversely, a recovery above 197.00, coinciding with the lower boundary of the Ichimoku cloud, could provide a signal for a potential reversal. In this scenario, the pair would need to reclaim and hold above 199.325 to confirm renewed bullish momentum and target higher levels. Overall, the pair is showing bearish sentiment in the short term, with key levels of support and resistance defining the boundaries of potential price action. Traders should closely monitor volume and RSI dynamics for additional clues on the next directional move.
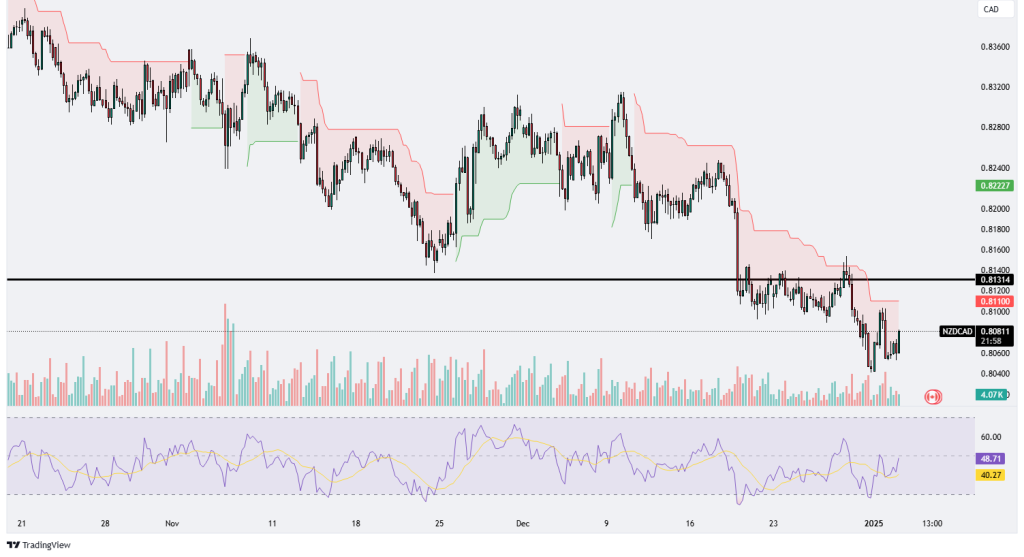
NZDCAD
The NZD/CAD chart illustrates a bearish trend with the price trading below the Ichimoku cloud, indicating sustained downward pressure. The pair recently attempted to recover but faced resistance near the 0.81100 level, which aligns with a key psychological barrier and a historical support-turned-resistance zone. The inability to close above this level confirms the sellers’ dominance. The volume profile shows a moderate increase during the recent drop, reflecting strong selling activity, while the subsequent recovery attempt lacked substantial buying momentum, as evidenced by lower volume.
The RSI is currently at 40.27, signaling weak bullish momentum in the recovery phase but still far from overbought territory, leaving room for further upside. However, the RSI trend suggests a neutral to bearish bias, as it remains below the 50 level. If the pair fails to maintain its current levels and breaks below 0.80600, it could extend its decline toward the next support area around 0.80000, a critical psychological level.
Conversely, a breakout above 0.81100, followed by a sustained move through the Ichimoku cloud’s lower boundary, could shift sentiment to neutral or bullish, targeting 0.82227 as the next resistance level. Traders should watch for volume dynamics and RSI confirmation to gauge the strength of any breakout or breakdown, as the pair currently shows mixed signals within a broader bearish context.


Leave A Comment