

EURUSD
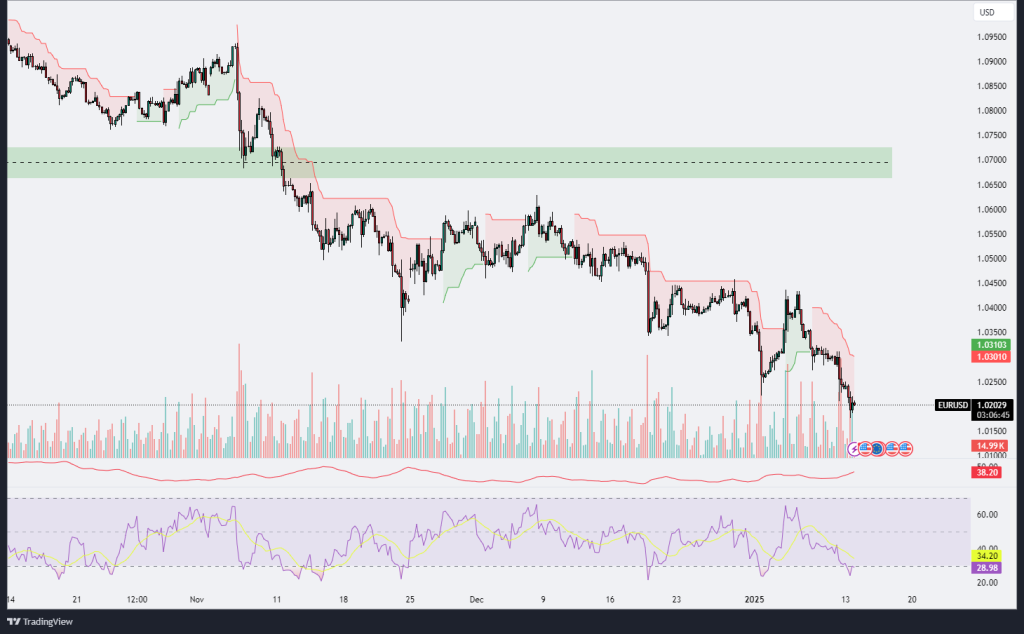
The EUR/USD chart demonstrates a persistent downtrend, as the price continues to trade below the Ichimoku cloud, indicating a bearish bias. The recent decline has pushed the price to the 1.0200 level, which aligns with a potential support zone. This area could attract buying interest, as it coincides with the RSI hovering around the oversold territory, signaling a possible rebound or short-term correction. However, the RSI remains weak at 29, reflecting sustained bearish momentum.
Volume data shows increased selling pressure during the recent price decline, emphasizing strong bearish control. The price has consistently rejected the Ichimoku cloud’s upper boundaries on previous attempts, highlighting the difficulty for bulls to regain dominance. Additionally, the MACD (if present below) might signal further downside, as it remains below the zero line with bearish crossovers.
For the pair to recover, a decisive break above the immediate resistance level at 1.0300, marked by the Ichimoku cloud’s lower boundary, is necessary. However, failure to hold the current support could result in further declines toward the 1.0100 psychological level. Traders should closely monitor the RSI’s behavior and volume patterns for signs of a potential reversal. Overall, the chart favors bears, but oversold conditions hint at a potential relief rally in the near term.
GBPUSD
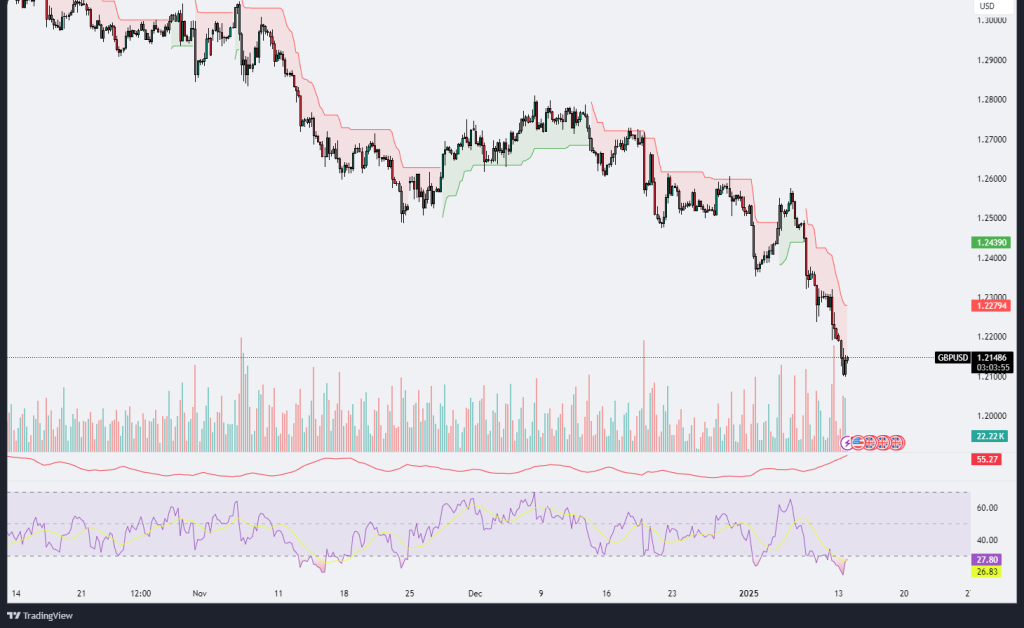
The GBP/USD chart exhibits a strong bearish trend, highlighted by a consistent series of lower highs and lower lows. The price has recently broken below a significant support level, now acting as resistance around the 1.2279 mark. This downward movement is accompanied by increasing volume, indicating strong seller interest and momentum in the market. The Ichimoku cloud is red and widening, confirming bearish dominance and suggesting that any potential recovery may face significant resistance. The RSI is hovering in the oversold territory, around 26-28, which could signal a possible short-term relief rally; however, the overall sentiment remains bearish as long as the price stays below the cloud and key resistance levels. Traders should watch for any consolidation or pullbacks toward the resistance level, which could provide opportunities for short positions if the bearish trend resumes. Additionally, a divergence on the RSI could be an early sign of exhaustion in the current downtrend, but this would require further confirmation from price action.
XAUUSD
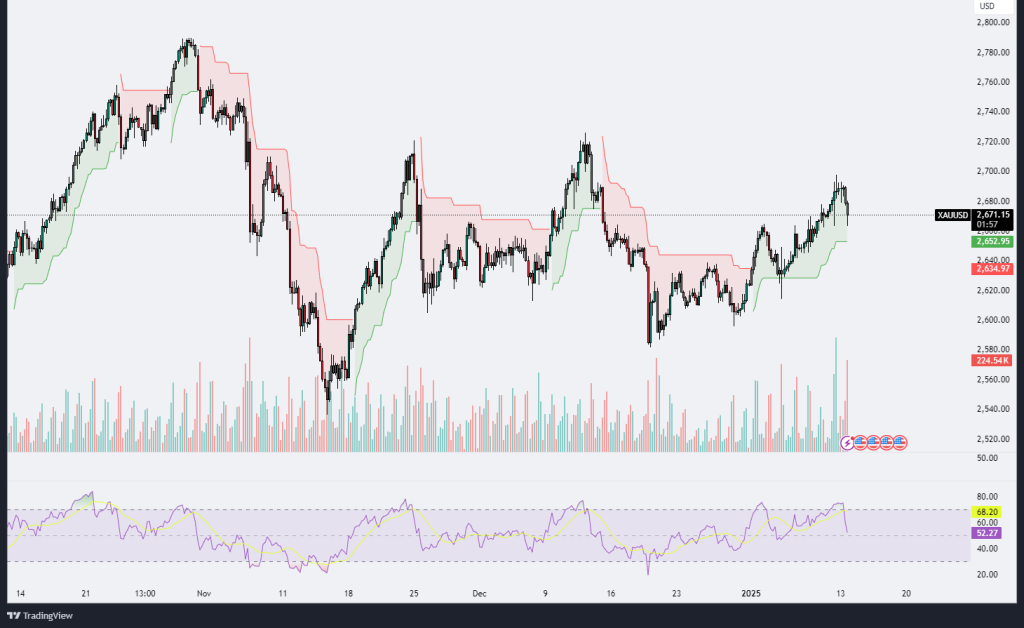
The XAU/USD chart demonstrates a mixed trend, where the price has recently pulled back from a local high near the $2,700 level. This decline is reflected by a notable spike in trading volume, suggesting active profit-taking or increased selling pressure. The Ichimoku cloud analysis reveals that the price had been in a bullish zone but is now showing signs of hesitation as it approaches the cloud’s lower boundary near $2,640, which may serve as a crucial support level. The RSI has dipped from the overbought zone and is currently around 51-68, indicating a weakening bullish momentum but not yet signaling oversold conditions. This could suggest that the pullback is a natural correction within the broader uptrend, although further bearish pressure could shift the momentum. Traders should watch for a bounce around the $2,640 support to confirm the continuation of the bullish trend or a break below this level to indicate a potential deeper retracement. Additionally, the significant increase in volume could act as a warning for potential volatility in the upcoming sessions.
XAGUSD
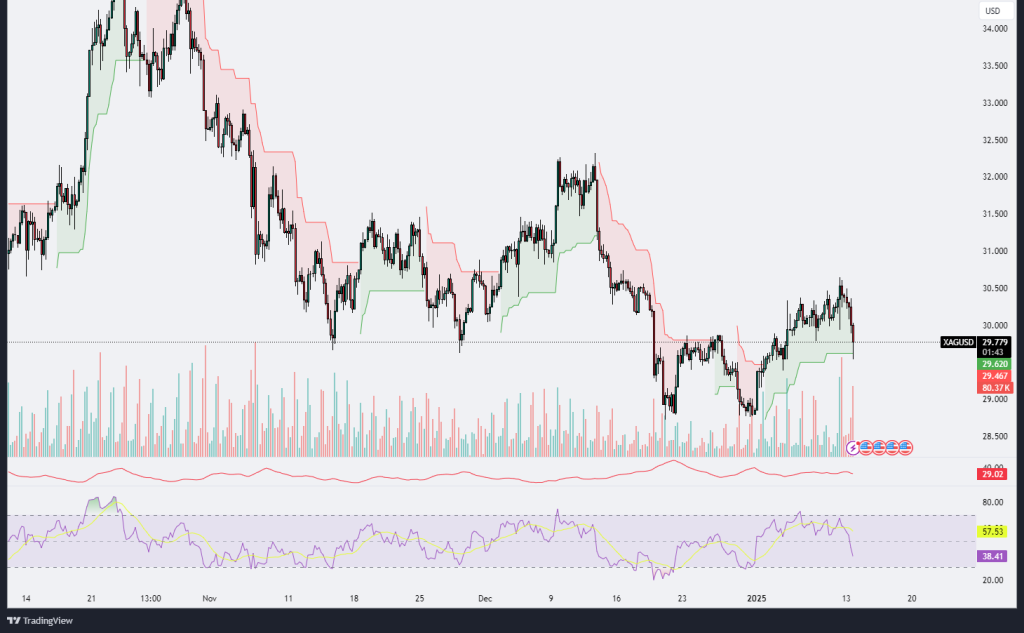
The XAG/USD (Silver vs. US Dollar) chart depicts a recent bearish momentum as the price declined sharply from the $30.50 resistance level, retreating to the $29.60 area. The Ichimoku cloud indicates that the price has shifted below the cloud’s upper boundary, suggesting weakening bullish momentum and potential continuation of the downward trend. This is further confirmed by a significant spike in trading volume, signaling strong selling pressure. The RSI has dropped from near overbought levels (above 57) to approximately 38, indicating a shift toward bearish conditions but not yet reaching oversold territory. The decline aligns with a rejection at a key resistance zone, followed by a swift drop, suggesting that sellers currently dominate the market. The lower boundary of the cloud near $29 could act as an immediate support level; a break below this could accelerate the decline toward the next psychological support at $28.50. Conversely, a bounce at current levels may lead to a retest of the $30.00-$30.50 resistance. Traders should closely monitor the RSI and volume activity for potential signs of either a continuation or a reversal in trend.


Leave A Comment