

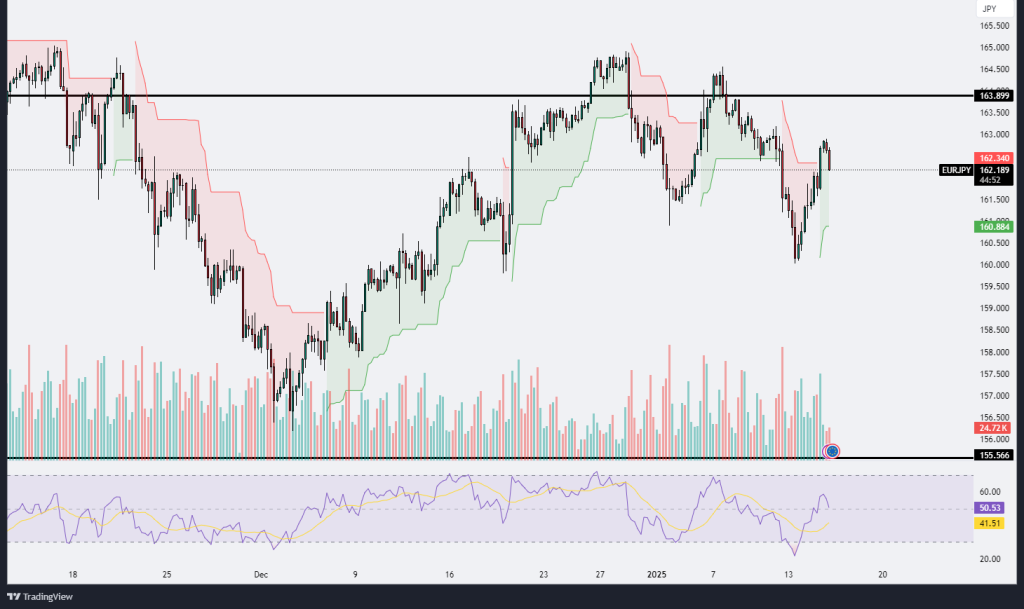
EURJPY
The EUR/JPY chart shows the pair struggling near the 162.34 level after a significant rebound from the recent lows around 160.88. The price attempted to recover from the prior downtrend, entering the Ichimoku cloud, but it is facing resistance below the key level of 163.89, which aligns with a critical horizontal barrier. The overall price structure suggests a mixed sentiment with bullish attempts to regain control, as indicated by the recovery into the cloud. However, the RSI is hovering near 50, reflecting neutral momentum and indecisiveness among market participants. Volume analysis shows a decrease in buying pressure after the recovery rally, hinting at weakening bullish momentum. If EUR/JPY fails to break above the resistance at 163.89, it could trigger a reversal, potentially targeting the support zone around 160.88. On the other hand, a breakout above the resistance with strong volume confirmation could pave the way for further bullish advances. Traders should closely monitor these key levels and volume dynamics to gauge the next directional move.
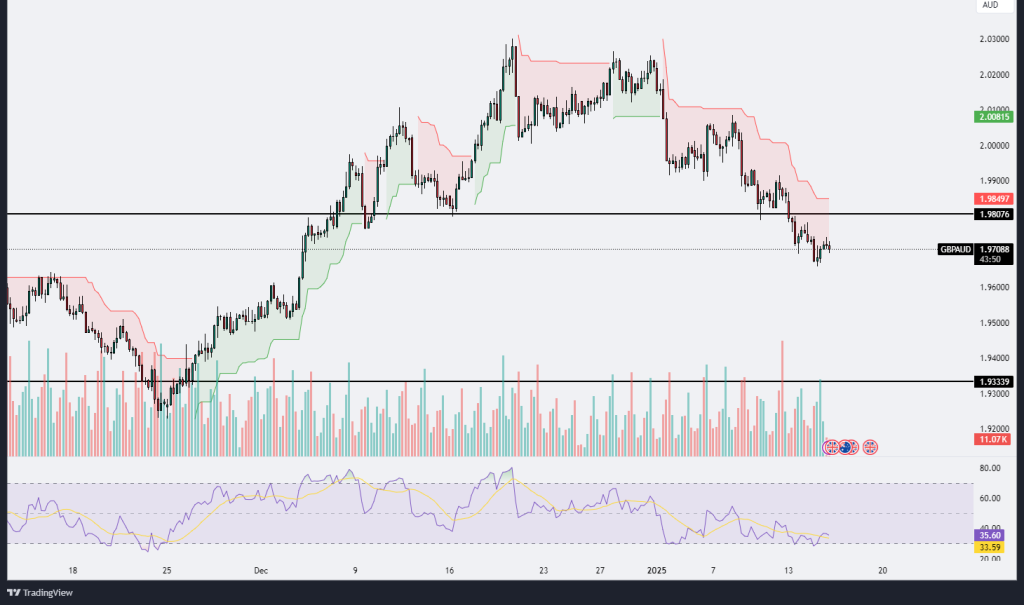
GBPAUD
The GBP/AUD chart demonstrates a clear bearish trend, with the price currently trading around 1.9708. After failing to maintain its position above the resistance level at 1.9849, the pair has continued its descent, approaching the key support level at 1.9807. Below this level, the next critical support lies at 1.9333, which has historically acted as a significant demand zone. The Ichimoku cloud analysis reveals bearish sentiment, as the price remains firmly below the cloud, indicating downward momentum. Additionally, the RSI is hovering near oversold territory around 35.56, suggesting that selling pressure persists but may also hint at a potential short-term rebound or consolidation. The volume profile shows a recent increase in activity, reflecting intensified market participation during the decline. However, the absence of a decisive break below 1.9807 could trigger a pullback, with potential resistance at the 1.9849 level. Traders should monitor these key levels closely, as a break below 1.9333 could signal a continuation of the downtrend, while a recovery above 1.9849 might indicate a shift in momentum.
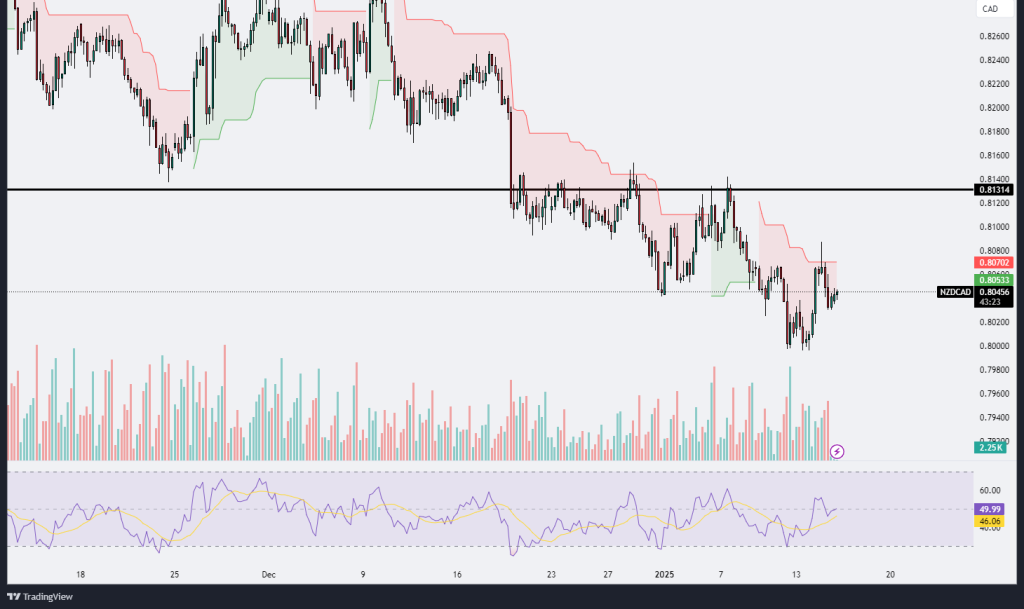
NZDCAD
The NZD/CAD pair is exhibiting a consolidative behavior just below a significant resistance level at 0.8131, as shown on the chart. After a sharp downward move, the price has found temporary support around the 0.8045 area and is attempting to recover. The Ichimoku cloud indicates bearish momentum, with the price remaining below the cloud and struggling to break above it. However, recent candlesticks suggest an attempt to challenge this resistance zone. The RSI is hovering near the 50 level, reflecting a neutral stance with no strong directional bias, although it shows a slight uptick, which could imply a potential push higher. Volume has remained relatively low during this recovery phase, signaling a lack of strong conviction among traders. A decisive break above 0.8131 could open the door for further upside toward the next resistance level, while failure to do so might result in renewed selling pressure targeting the 0.8000 psychological level. Traders should monitor volume and RSI closely for confirmation of any breakout or reversal in momentum.
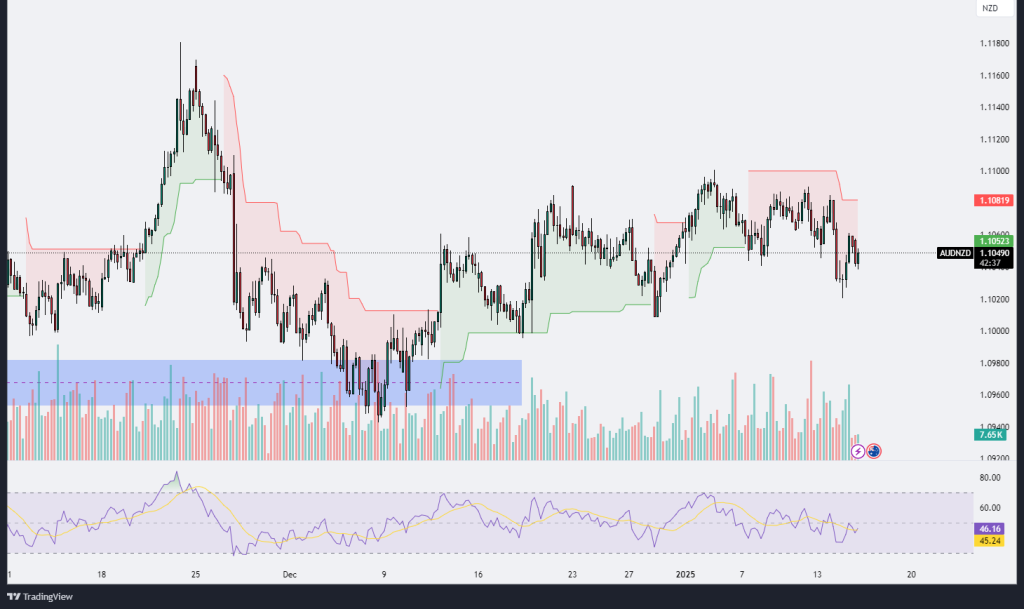
AUDNZD
The AUD/NZD pair is currently displaying range-bound behavior, with prices fluctuating around the 1.1050 level. Following a sharp decline from the highs near 1.1180, the pair has been attempting to stabilize, finding support in the 1.1000–1.1020 zone, marked by the blue shaded area on the chart. This level has historically acted as a demand zone, suggesting that buyers are stepping in to defend this key support. The Ichimoku cloud analysis shows the price trading below the cloud, indicating bearish momentum, but the recent uptick hints at an effort to retest the resistance around 1.1080. The RSI is hovering slightly below the 50 level, reflecting a neutral-to-bearish sentiment but showing signs of potential recovery. However, the RSI’s inability to break above the midline convincingly keeps the bearish outlook intact for now. Volume has remained relatively subdued, indicating that the recent movements lack strong conviction. A breakout above 1.1080 could signal a shift toward bullish momentum, targeting higher levels near 1.1120–1.1150. Conversely, a failure to maintain support around 1.1000 might lead to further declines, with the next potential target near 1.0950. Traders should watch for confirmation of breakout or breakdown levels, alongside changes in volume and momentum indicators.


Leave A Comment