

GBPJPY
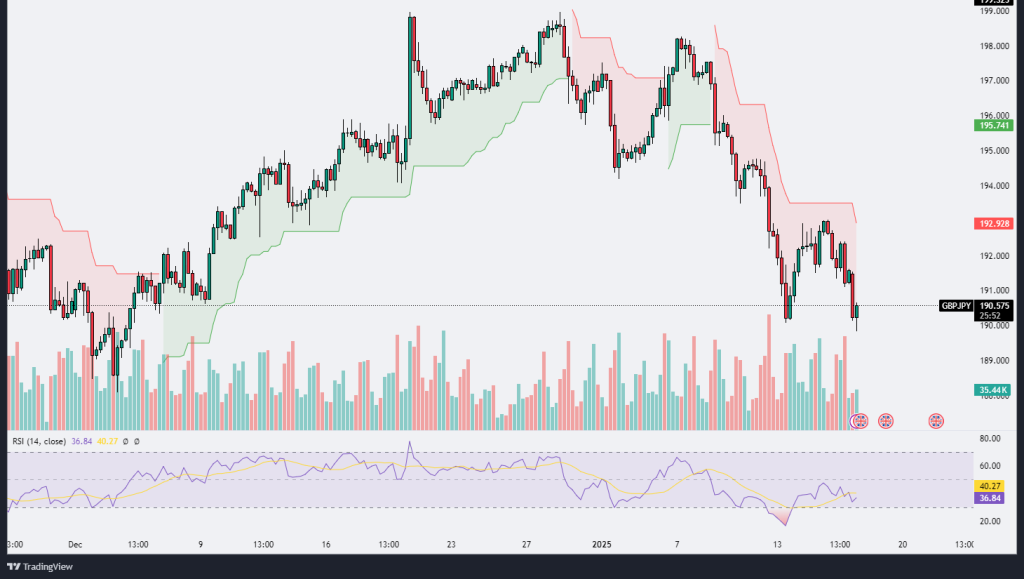
The GBP/JPY chart reveals a notable bearish trend as the pair breaks below key support levels, currently trading near 190.57. The Ichimoku cloud shows that prices are well below the cloud, reinforcing the bearish momentum. The supertrend indicator, set to 192.928, has turned bearish, further validating the downward pressure. This downward movement is accompanied by increasing volume, indicating strong selling interest. The RSI is hovering around 36.84, reflecting oversold conditions but suggesting that the selling momentum still dominates. However, the RSI’s position near oversold territory could indicate a potential corrective bounce if buyers start stepping in.
The psychological level near 190.00 acts as immediate support, and a break below this level could lead to further downside, targeting 188.50. On the upside, the pair would need to reclaim the 192.92 level to negate the current bearish structure and shift toward a bullish bias. Traders should watch for volume confirmation and RSI divergence to identify potential reversal points. Overall, the bearish sentiment remains dominant, and caution is advised before entering long positions until stronger signs of reversal emerge.
AUDCAD
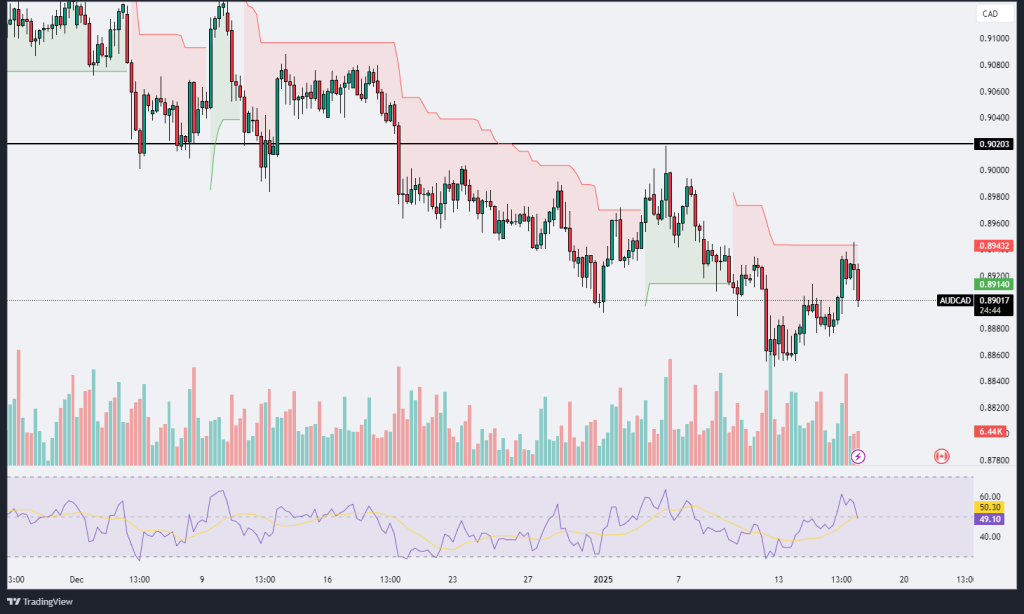
The AUD/CAD chart demonstrates a consolidative structure with the price hovering near the 0.8910 level after failing to breach the resistance zone at 0.8943. The Ichimoku cloud indicator shows bearish sentiment as the price trades below the cloud, although recent price action suggests attempts at bullish recovery. The supertrend remains bearish, further solidifying resistance at 0.8943 as a critical level to watch for upside momentum. The Relative Strength Index (RSI) at 49.10 highlights neutral momentum, with no clear overbought or oversold signals, suggesting indecision in the market.
Volume data indicates that trading activity remains moderate, with no significant spikes suggesting strong conviction in either direction. Immediate support lies around 0.8880, and a break below this level could open the door to further downside toward 0.8840. On the upside, sustained buying pressure above 0.8943 could push the pair toward the psychological 0.9020 mark, which serves as a key resistance level. Traders should closely monitor any divergence on the RSI or shifts in volume for early signs of directional movement. For now, the market remains range-bound, and caution is advised until a clear breakout or breakdown occurs.
NZDCHF
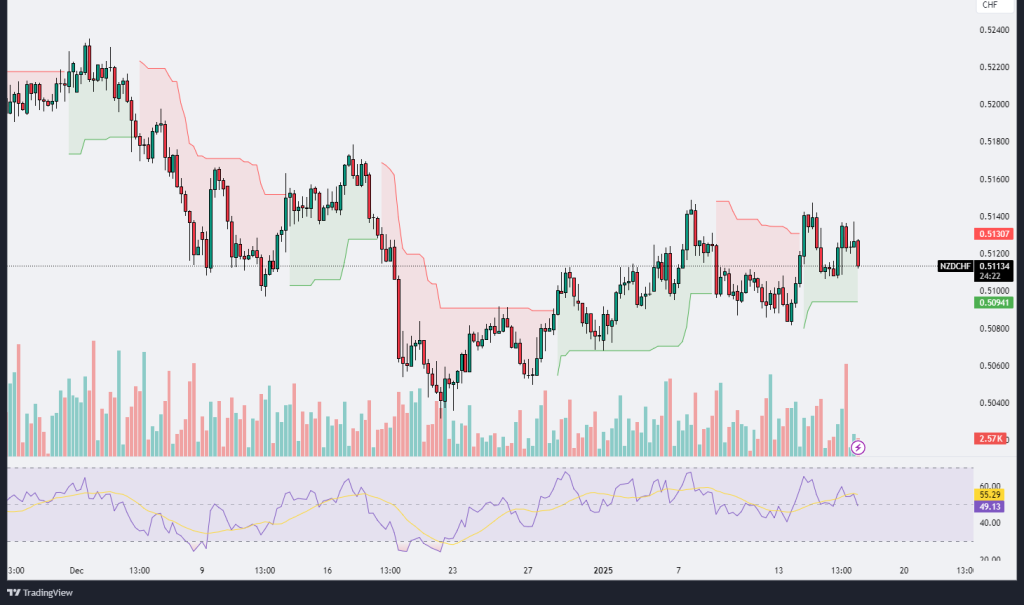
The NZD/CHF chart reflects a consolidative price action around the 0.5110 level, with multiple attempts to break through the resistance at 0.5130. Despite minor bullish breakouts, the pair has failed to sustain upward momentum, indicating continued bearish pressure. The Ichimoku cloud signals mixed sentiment as the price oscillates between bullish and bearish zones, reflecting market indecision. However, the current price is slightly leaning toward a bearish tone as it retreats below the recent resistance level.
The volume remains relatively subdued, with no significant increases indicating strong buying or selling pressure. This lack of strong conviction could signal an upcoming breakout or breakdown when volume increases. Meanwhile, the Relative Strength Index (RSI) is hovering near the neutral 50 level, suggesting neither overbought nor oversold conditions, reinforcing the notion of market uncertainty.
The key support level at 0.5090 is crucial to watch, as a break below this could result in further declines toward the 0.5060 level. On the other hand, a successful push above 0.5130 with strong volume could pave the way for further gains, targeting the next resistance at 0.5160. Traders should closely observe volume trends and momentum shifts in the RSI to gauge the next significant move in this pair. For now, the pair remains range-bound with no clear directional bias, suggesting caution and careful monitoring for breakout signals.
GBPCAD
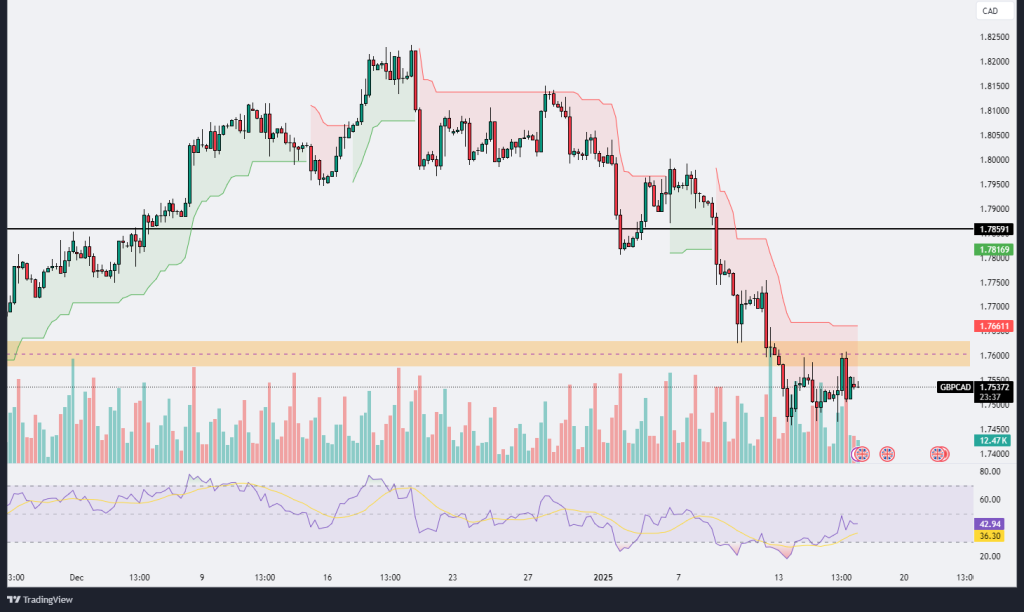
The GBP/CAD chart reveals a corrective phase within a broader bearish trend. After a strong downward movement, the pair has entered a consolidation zone, as evidenced by the price action forming around the highlighted resistance zone near 1.7660. This zone represents a critical supply area where sellers have previously dominated, and recent price attempts to breach this level have failed. The Ichimoku cloud reflects bearish sentiment, with the price trading below the red cloud, indicating that downward pressure is still present.
Volume analysis suggests reduced momentum on recent upward moves, which could indicate a lack of buying strength to push the price higher. The Relative Strength Index (RSI) hovers near the 43 level, suggesting slightly bearish momentum but not in oversold territory, leaving room for further declines if selling pressure increases.
On the downside, the support around 1.7450 is critical, as a breakdown below this level could accelerate bearish momentum, potentially driving the pair toward the 1.7300 region. Conversely, if the pair breaks above 1.7660 with strong volume, it could invalidate the bearish structure and trigger a move toward the next resistance near 1.7850. For now, traders should monitor price behavior within this range and wait for a decisive breakout to confirm the next trend direction.


Leave A Comment