

EURUSD
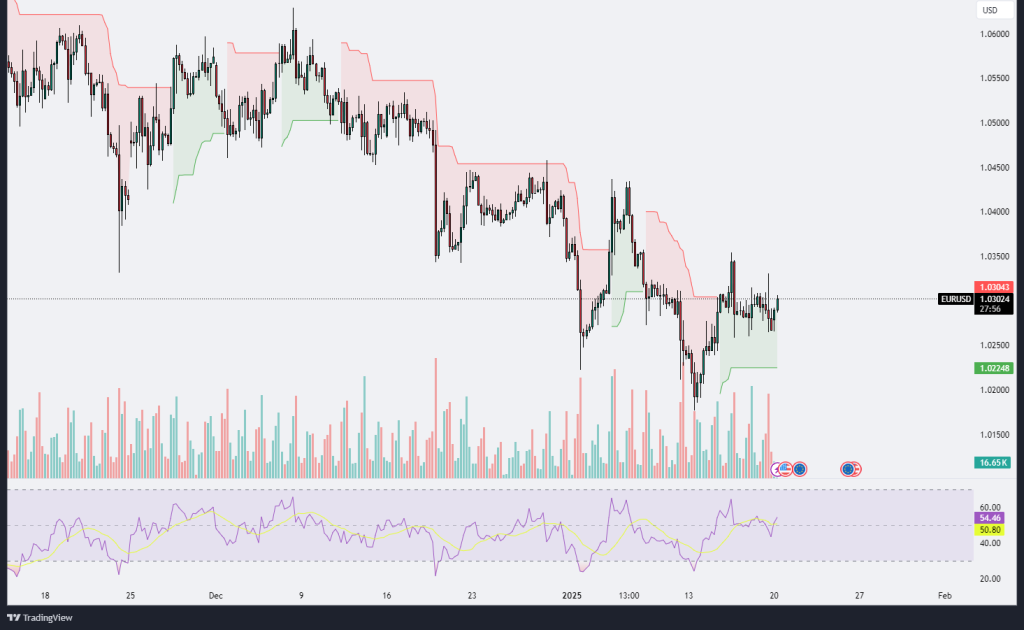
The EURUSD chart displays a consolidation phase following a downward trend that found support near the 1.0225 level. Currently, the price is trading around 1.0304, slightly above the Ichimoku cloud, suggesting a potential transition toward bullish momentum, but the movement remains indecisive. The volume has decreased compared to previous sessions, indicating a lack of strong buying or selling pressure at this stage. The RSI is at 50.80, reflecting a neutral sentiment, with no significant overbought or oversold conditions.
The price attempted to break above the resistance near 1.0350 but failed to sustain, suggesting that sellers are still active at higher levels. If the pair continues to hover within this consolidation range, it may face challenges in either breaking out or resuming its previous downward momentum. A decisive breakout above 1.0350 would open the door for a potential rally toward the next resistance near 1.0400. Conversely, a breakdown below 1.0250 could reignite bearish momentum, targeting the 1.0200 level.
Traders should monitor volume and RSI closely for signals of an impending breakout or breakdown. A significant increase in volume alongside a clear price movement above resistance or below support would provide a stronger directional bias. Patience is key, as the pair currently lacks a clear trend, and trading within this range could yield false signals without proper risk management.
GBPUSD
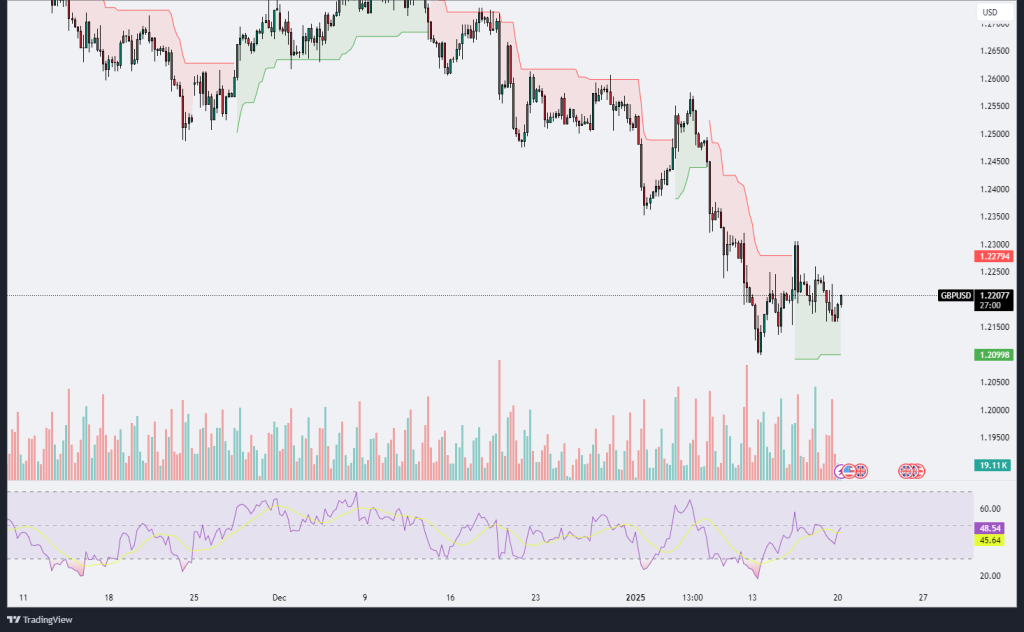
The GBPUSD chart shows a slight recovery after hitting a low near 1.2100. Currently trading around 1.2207, the pair is showing signs of consolidation with price action moving within a relatively narrow range. The Ichimoku cloud indicates a bearish bias as the price remains below the cloud, but the recent upward movement suggests that buyers are attempting to regain control. Volume has slightly decreased compared to earlier sessions, reflecting a more cautious market sentiment. The RSI at 48.56 indicates a neutral stance, with neither overbought nor oversold conditions being dominant.
The 1.2250 level is acting as immediate resistance, while the 1.2100 zone serves as strong support. A breakout above the 1.2250 level could signal a potential bullish reversal, targeting the 1.2300 region and possibly higher levels if momentum increases. However, failure to break above this resistance may lead to renewed selling pressure, pushing the price back toward the 1.2100 support. The RSI’s gradual movement toward the 50 mark reflects the lack of a clear directional trend, with traders waiting for stronger signals.
Overall, the GBPUSD pair is in a consolidation phase within a bearish overall structure. Traders should closely monitor the resistance and support levels for breakout or breakdown scenarios. A sustained move above the Ichimoku cloud could confirm a shift in sentiment toward bullishness, while a drop below the 1.2100 support could extend the downtrend. Patience and careful risk management are recommended in this mixed market environment.
XAUUSD
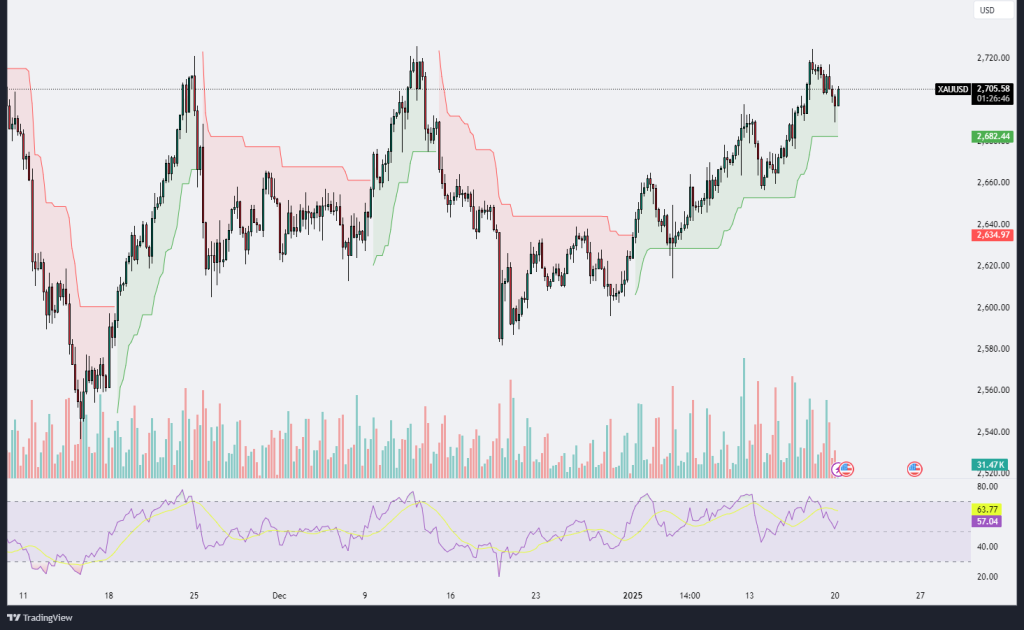
The XAUUSD chart reveals a steady upward trend, with the price currently trading around the 2,705 level. The bullish momentum is supported by the price staying above the Ichimoku cloud, which serves as dynamic support. The recent pullback from its highs near 2,720 suggests short-term profit-taking, but the overall structure remains bullish. Volume activity shows a moderate increase during upward movements, indicating consistent buying interest. The RSI currently sits at 63.78, signaling strong bullish momentum without yet reaching overbought conditions, leaving room for further upside.
The key resistance level lies around 2,720, which aligns with the recent high and represents the next hurdle for buyers to overcome. A breakout above this resistance could drive the price toward higher levels, potentially targeting the 2,750 region. On the downside, immediate support is at 2,680, which coincides with the lower edge of the recent consolidation range. A break below this level could attract selling pressure and test further support around 2,640, where the Ichimoku cloud base resides.
Overall, the chart portrays a bullish outlook for XAUUSD, supported by technical indicators and a constructive price structure. Traders should watch for a decisive break above 2,720 for continuation of the bullish trend, while closely monitoring the 2,680 support level for potential downside risks. Proper risk management is essential, given the volatility typically associated with gold.
XAGUSD
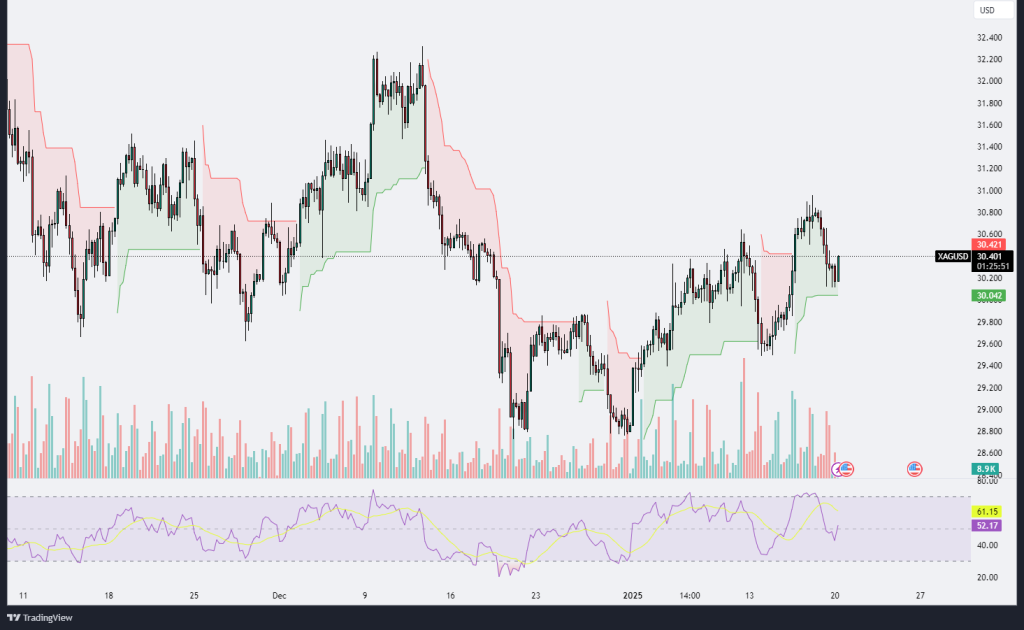
The XAGUSD (silver versus the US dollar) chart demonstrates a recovery phase after a significant downward movement, with the price currently trading around the $30.42 level. Following a strong rebound from the $29.80 support zone, the price has managed to climb above the Ichimoku cloud, indicating a transition from bearish to bullish sentiment in the short term. The recent pullback from its local high near $30.60 shows some profit-taking, yet the price remains supported by the Ichimoku cloud, which serves as a dynamic area of support.
Volume analysis indicates moderate activity, suggesting a balance between buying and selling pressure, with buyers holding the upper hand for now. The RSI indicator is at 61.15, showing bullish momentum but nearing overbought conditions. This suggests the potential for further gains, although caution is warranted as overbought levels could trigger a short-term correction.
Key resistance lies at $30.60, which, if broken, could propel the price toward the $31.00 psychological level. On the downside, immediate support is found at $30.20, with further support at $29.80, which marks the rebound point from the previous decline. A sustained move above $30.60 would reinforce the bullish outlook, while a break below $30.20 might signal a deeper retracement toward the support at $29.80.


Leave A Comment