


EURJPY
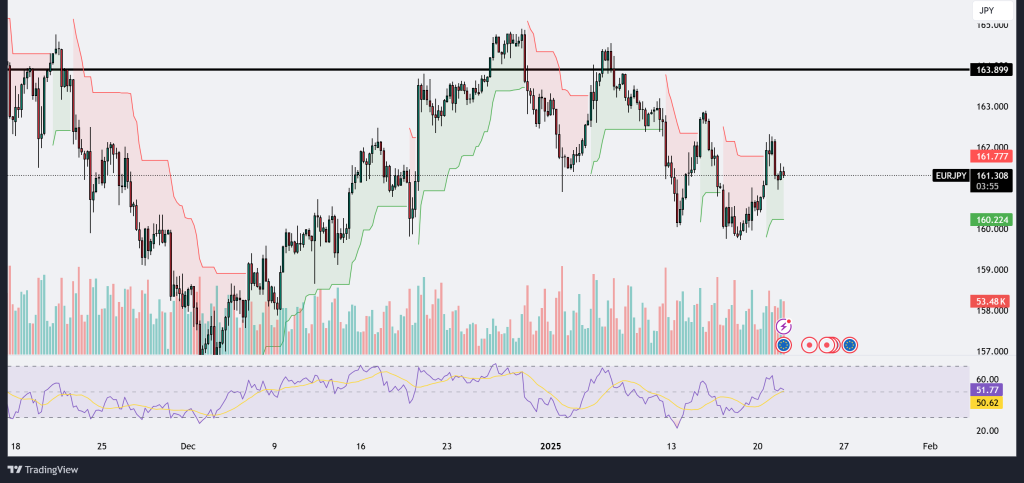
The EURJPY chart exhibits a mixed market structure with recent price movements reflecting consolidation after a period of volatility. Currently trading at 161.300, the price shows resistance near the 161.777 level, with sellers halting the upward momentum seen earlier this month. The Ichimoku cloud provides a visual representation of market dynamics, with the price currently within the cloud, signaling uncertainty and a lack of clear trend direction. Support is evident near the 160.224 level, which coincides with the lower boundary of the cloud, potentially acting as a cushion for further downside moves.
The volume profile reveals moderate trading activity, suggesting neither buyers nor sellers are overwhelmingly dominant. The RSI indicator hovers around 51.68, indicating neutral momentum but leaning slightly toward bullish sentiment. However, the RSI has recently dipped from overbought levels, reflecting a loss of upward strength, which may lead to a potential retest of the support zones.
Key levels to watch include the 163.899 resistance, a pivotal area that marks the upper range of recent highs, and the 160.224 support, critical for maintaining bullish sentiment. A breakout above 161.777 could trigger further buying interest, targeting the 163.899 resistance. Conversely, a break below 160.224 might lead to increased selling pressure, with the next potential target around 158.000.
In summary, EURJPY is currently in a consolidation phase, with traders likely awaiting a decisive breakout or breakdown to determine the next directional move. Monitoring volume, momentum, and the reaction at key levels will be crucial for gauging market sentiment and potential trading opportunities.
GBPCAD
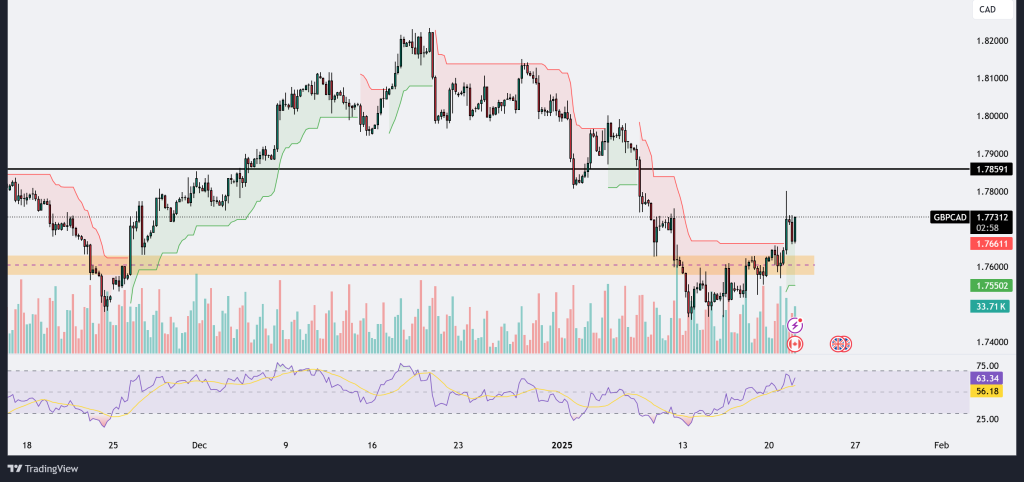
The GBPCAD chart demonstrates a notable upward movement after breaking through the key support-turned-resistance zone at 1.76611, highlighted by the orange shaded area. This area has previously acted as a significant level, reflecting a struggle between buyers and sellers. The recent breakout has been accompanied by a sharp increase in volume, suggesting strong buyer interest and momentum. Currently trading at 1.77316, the pair faces a critical resistance level at 1.78591, which aligns with a recent high and is likely to act as a psychological barrier for further upward movement.
The Ichimoku cloud indicates a potential trend continuation as the price is positioned above the cloud, signaling bullish momentum. The RSI indicator is currently at 63.37, indicating that the pair is approaching overbought levels, which may lead to some consolidation or minor pullback before the next leg higher. However, the RSI’s consistent upward trajectory suggests sustained bullish pressure.
If the price sustains above the 1.76611 level, it could validate the breakout and provide a base for further gains toward 1.78591. A rejection at the current level or the resistance zone could lead to a retest of the 1.76611 support or even the 1.75502 level, where additional buying interest may emerge. Traders should monitor volume activity and momentum indicators closely to gauge the strength of the current trend and potential reversals.
EURCHF
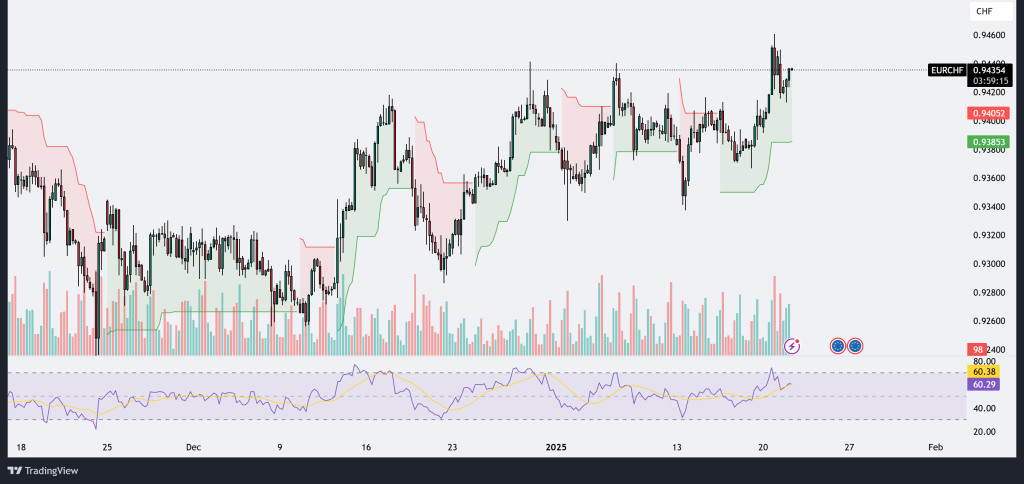
The EURCHF chart shows a steady upward trend, with the pair currently trading around 0.94354. The recent bullish momentum is supported by the price positioning itself well above the Ichimoku cloud, indicating a strong bullish sentiment in the market. Additionally, the breakout from the previous consolidation zone suggests that buyers are taking control, pushing the pair higher. The volume during the breakout appears consistent, which supports the strength of the move. The RSI is at 60.38, slightly above the neutral 50 level, suggesting there is room for further upward movement, although the indicator is approaching overbought levels, which may signal caution for new long positions.
Key resistance lies ahead at higher levels, which could act as a barrier if buyers fail to maintain momentum. The nearest support level is around 0.94052, which aligns with the top of the previous consolidation range and could serve as a retest zone if a pullback occurs. Traders should monitor volume and RSI divergence closely to determine whether the bullish momentum can sustain or if a correction is imminent. A continuation above the current levels could open the door to testing new highs, while a break below the support could signal a reversal in the short-term trend.
USDCAD
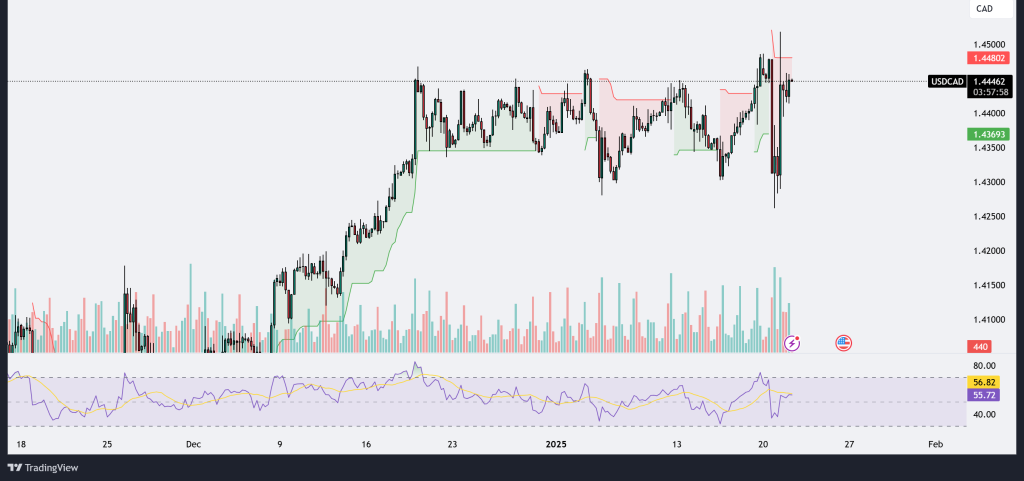
The USD/CAD chart illustrates significant volatility in recent sessions, with the price trading near 1.44462. The pair recently experienced a sharp spike followed by a quick reversal, reflecting indecision and potential rejection near the key resistance level of 1.44802. This level has previously acted as a ceiling, and the inability to break above it convincingly indicates selling pressure. The price is currently consolidating within a tight range above the Ichimoku cloud, suggesting that while the overall trend remains bullish, there is hesitation among buyers.
The RSI is hovering around 56.82, which indicates moderate bullish momentum but not overbought conditions. This implies room for further upside, provided buyers regain control and push the price above the critical resistance zone. However, the volume profile shows reduced activity during the consolidation phase, suggesting that the breakout will need stronger participation to sustain momentum. On the downside, immediate support lies near 1.43693, coinciding with the Ichimoku cloud’s lower boundary. A break below this level could signal a deeper retracement, potentially targeting lower support levels around 1.4300.


Leave A Comment