


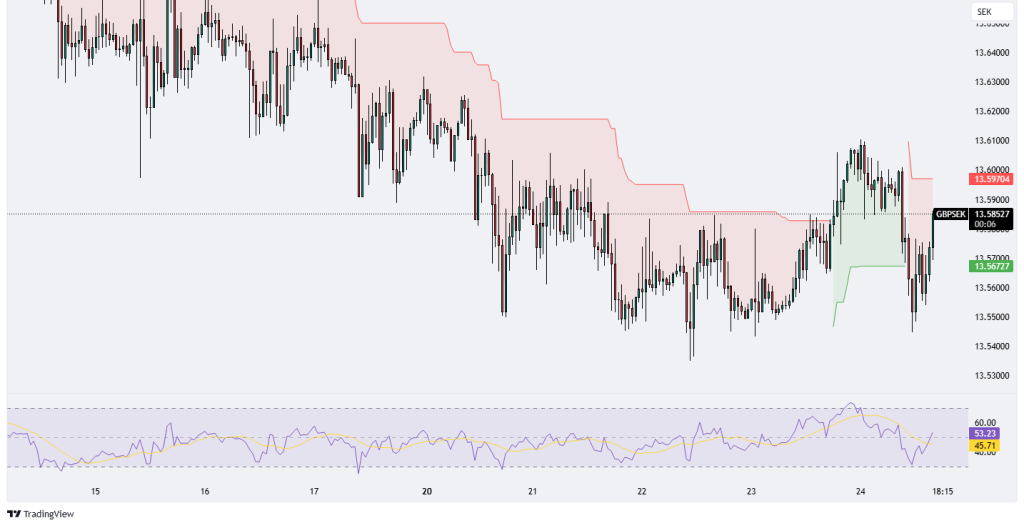
GBPSEK
The GBP/SEK chart shows a highly volatile trading environment over the recent sessions, with the price currently oscillating around 13.58484. The supertrend indicator displays mixed signals, as the price has been switching between bullish and bearish zones, reflecting a lack of clear directional momentum. Resistance near 13.6000 is acting as a psychological barrier, with recent attempts to break above being unsuccessful. On the downside, 13.5670 appears to provide short-term support, as buyers have stepped in to prevent further declines. The RSI is hovering at 53.05, suggesting mildly bullish momentum but not in overbought territory, leaving room for further upside if buying pressure increases. However, the RSI’s recent movement from oversold levels indicates that the pair might still be in a consolidation phase. Volume spikes during recent upswings hint at buying interest, but subsequent retracements with lower volume suggest caution among market participants. Overall, GBP/SEK remains range-bound, and a break beyond the resistance at 13.6000 or below the support at 13.5670 could signal the next directional move. Traders should monitor these levels closely for potential breakout or reversal opportunities.
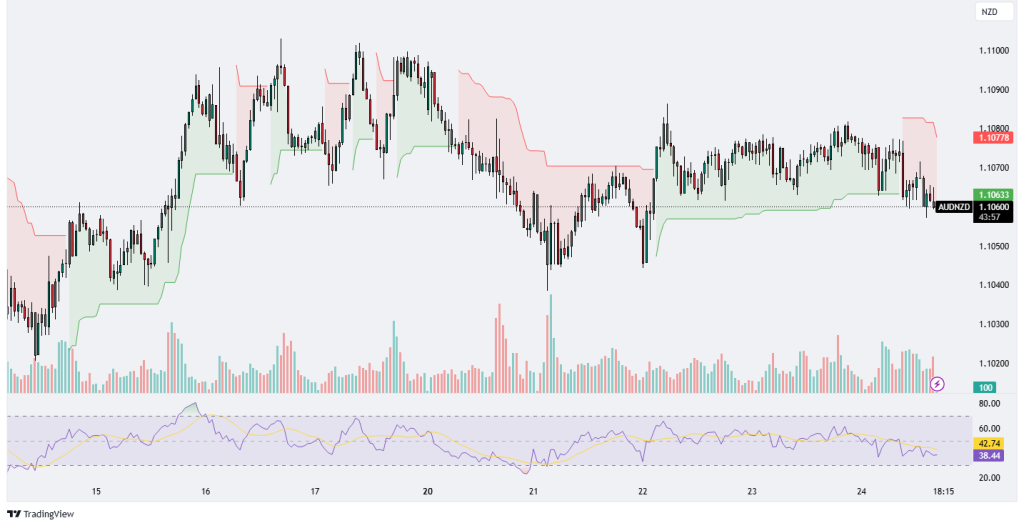
AUDNZD
The AUD/NZD chart is exhibiting a sideways consolidation pattern, with the price currently hovering around 1.10598. The supertrend indicator shows a bearish bias as the price remains below the resistance level at 1.10778, with the recent candles unable to establish a breakout above this point. Support is visible at 1.10633, providing a critical zone for buyers to step in. The RSI is trending lower at 38.10, signaling bearish momentum and suggesting the possibility of continued downside pressure if selling activity persists. Volume appears subdued during recent movements, which indicates a lack of strong conviction among market participants. This lack of directional momentum may lead to further consolidation unless a significant catalyst triggers a breakout in either direction. Traders should closely watch the 1.10778 resistance level for potential upside momentum or the support at 1.10633 for a possible breakdown. A decisive move beyond these levels could indicate the next trend direction, with the RSI serving as a key confirmation tool for either a recovery or continuation of the bearish trend.
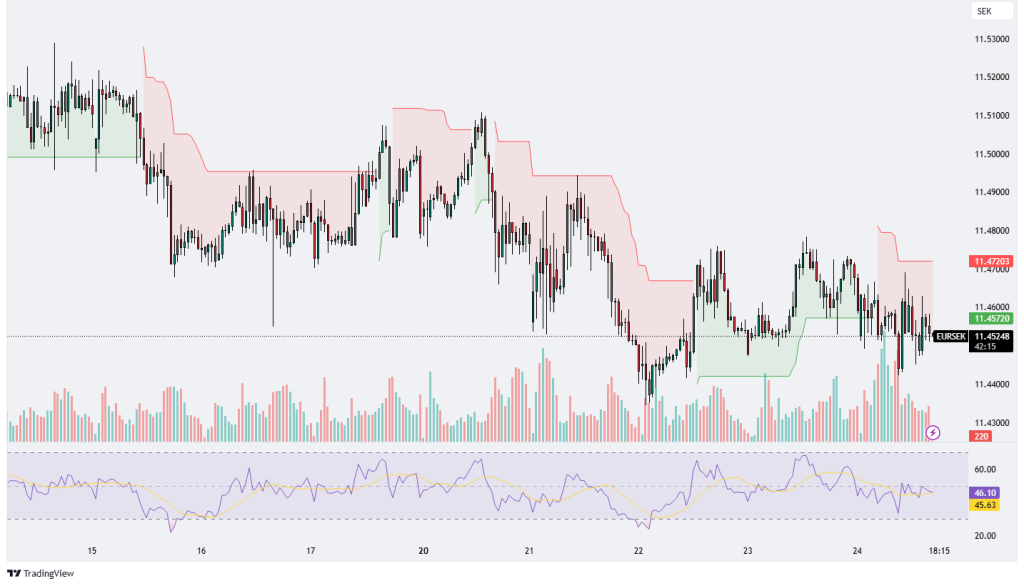
EURSEK
The EUR/SEK chart displays a sideways consolidation with minor fluctuations, indicating indecision in the market. The price is currently trading around 11.45247, slightly below the resistance level at 11.47203, as shown by the supertrend indicator, which signals a bearish bias above the price. Support is visible near 11.45720, which has acted as a buffer against further declines. The RSI is flat near the 45-46 range, reflecting a lack of momentum in either direction, with no immediate overbought or oversold conditions. Trading volume is relatively subdued, suggesting that traders are awaiting stronger cues before committing to a directional move. The lack of a decisive trend implies that the pair may remain range-bound unless a breakout occurs above the resistance or below the support. A breakout above 11.47203 could indicate bullish momentum, while a drop below 11.45720 might signal further downside. Traders should monitor these key levels and watch for increased volume or changes in RSI dynamics as potential indicators of an impending move.
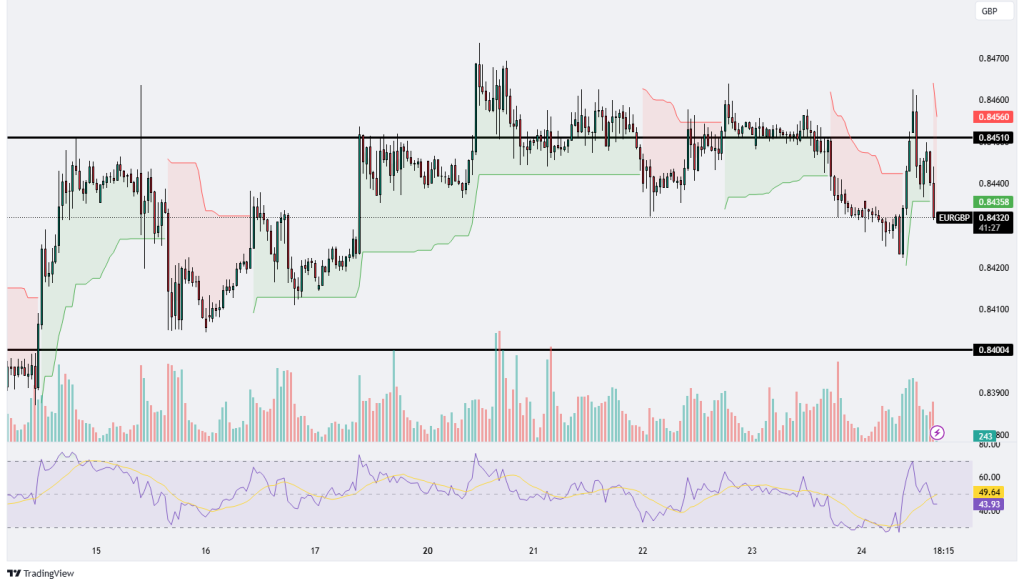
EURGBP
The EUR/GBP chart demonstrates a clear range-bound trading environment, with the price oscillating between the resistance level at 0.84560 and the support level at 0.84004. The pair is currently trading around 0.84322, showing a retracement after briefly testing the resistance zone. The supertrend indicator reflects a bearish signal as the price has fallen below the mid-range of 0.84510. The RSI is trending downward, currently near 44, suggesting declining momentum and a potential move toward oversold conditions if the bearish pressure persists. Volume activity indicates a spike during the recent breakout attempts, suggesting strong participation near key levels, but the failure to sustain higher prices signals selling pressure at resistance. Traders should watch for a potential break below the 0.84004 support, which could lead to further downside momentum, or a rebound near this level for a reversal toward the upper boundary of the range. A sustained close above 0.84560 is necessary for a bullish breakout scenario, but for now, the pair remains neutral within its established range.


Leave A Comment