


Today’s market momentum update highlights critical resistance zones across oil and major U.S. indices. Brent crude is testing $68.70, while the market momentum update also shows consolidation near highs in Nasdaq, Dow, and S&P 500 futures. Traders now watch for potential breakouts or corrective moves.
BRENT
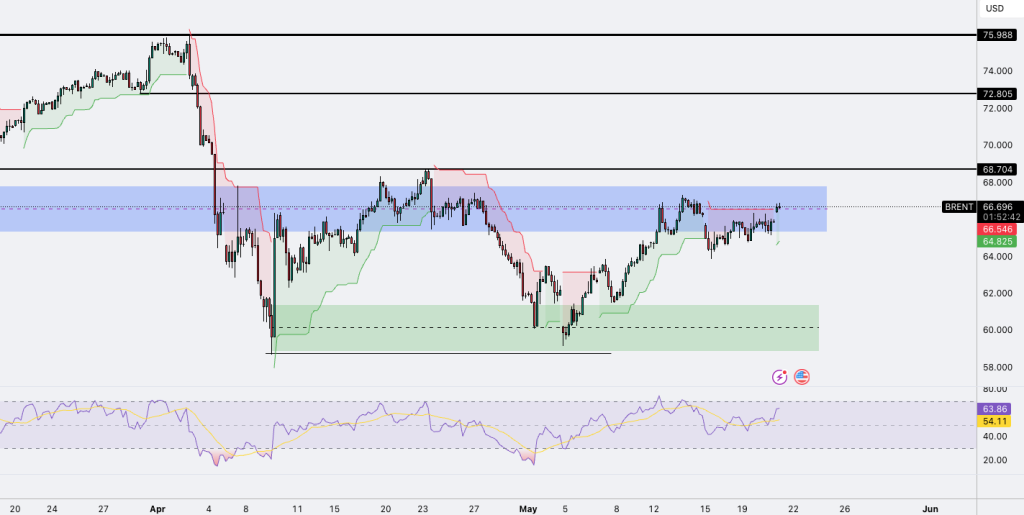
🛢️ Brent Crude Retests $68.70 – Extend the Momentum or Pull Back?
Brent crude tests $68.70 resistance after a strong rebound. RSI above 63 signals momentum, but failure to break may lead to $64.80 or $62.
Brent crude is currently testing the upper boundary of a key resistance zone between $66.70 and $68.70. Following a strong recovery from the $60 demand zone, price has steadily climbed back into the previously rejected supply area. A confirmed daily close above $68.70 could open the way toward higher resistance levels at $72.80 and $75.98. However, failure to break through may trigger a pullback toward $64.80 or even the $62.00 demand region. RSI has crossed above 63.86, suggesting bullish divergence, while Ichimoku-based trailing stops continue to support the short-term bullish trend.
ES (S&P 500 Futures)
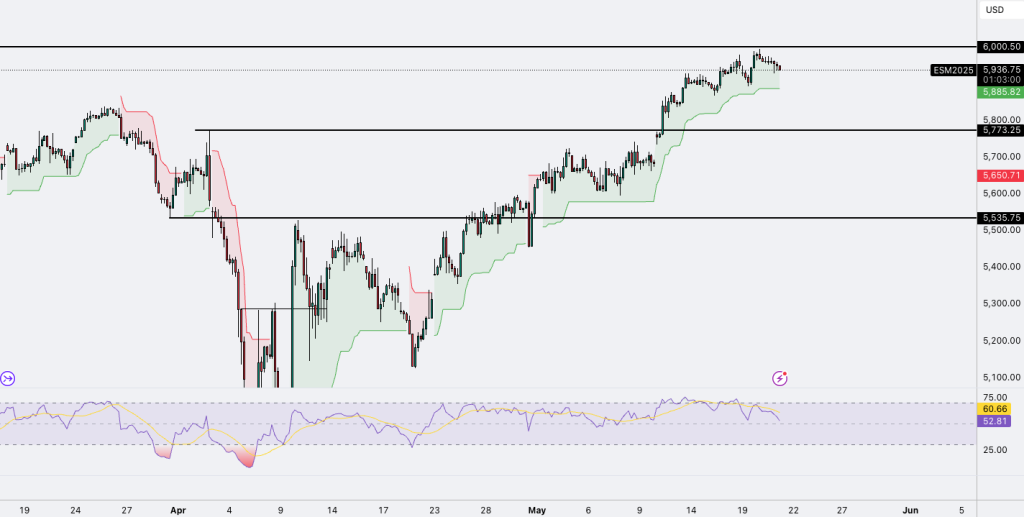
📊 S&P 500 Futures Pause Below 6000 – Breakout or Cooldown?
ES consolidates below 6000 after extended uptrend. RSI cools from overbought, but support holds. Breakout = new highs; failure = $5773 retest.
S&P 500 E-mini Futures (ES) remain in a well-established uptrend but are showing early signs of momentum loss as price consolidates just below the psychological 6000 level. Since the mid-April breakout, the bullish structure has been supported by a green trailing stop band that remains intact. While RSI is cooling off from overbought territory, it still sits above the midline—signaling continued bullish strength. A confirmed breakout above 6000 could trigger the next leg higher, whereas a failure to make new highs may lead to a pullback toward the $5773.25 support level.
DJI (Dow Jones Index)
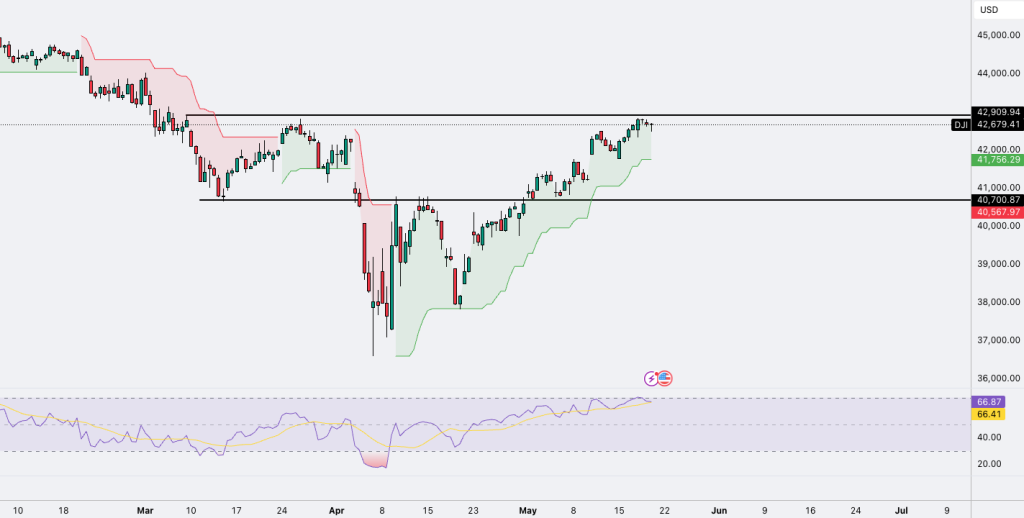
📈 Dow Jones Stalls Below 42,910 – Breakout or Bull Trap?
DJIA consolidates below 42,910 resistance. RSI near 67 shows bullish strength, but divergence risk rises. Breakout = ATH, failure = caution.
The Dow Jones Industrial Average (DJI) is approaching a key resistance level at 42,909.94 after a strong recovery from the $40,700 support area. Price is currently consolidating just below resistance, and a confirmed breakout could pave the way for new all-time highs. The RSI stands at 66.87, reflecting solid bullish momentum, though a bearish divergence could emerge if price stalls while RSI trends lower. The trailing support indicator continues to hold, maintaining the short-term bullish structure, but caution is advised as the index nears critical resistance.
NQ (Nasdaq Futures)
🚀 Nasdaq Futures Hover Below $21,464 – Next Break Imminent?
NQ consolidates near $21,464 after May breakout. RSI drops to 52.73, signaling cooling momentum. Break above = trend resumes; below = $20,600 retest.
Nasdaq 100 Futures (NQ) have surged through the $20,000 supply zone and are now consolidating just beneath the key resistance level at $21,464.50. The early-May breakout triggered a strong rally, but price is now stabilizing within a tight range. RSI has cooled from overbought levels to 52.73, indicating waning momentum while still holding above the neutral 50 threshold. A breakout above $21,464.50 would confirm trend continuation, while a drop below $21,068.40 may signal a pullback toward the $20,536–$20,600 support band.


Leave A Comment