


Bitcoin (BTC/USDT) Analysis
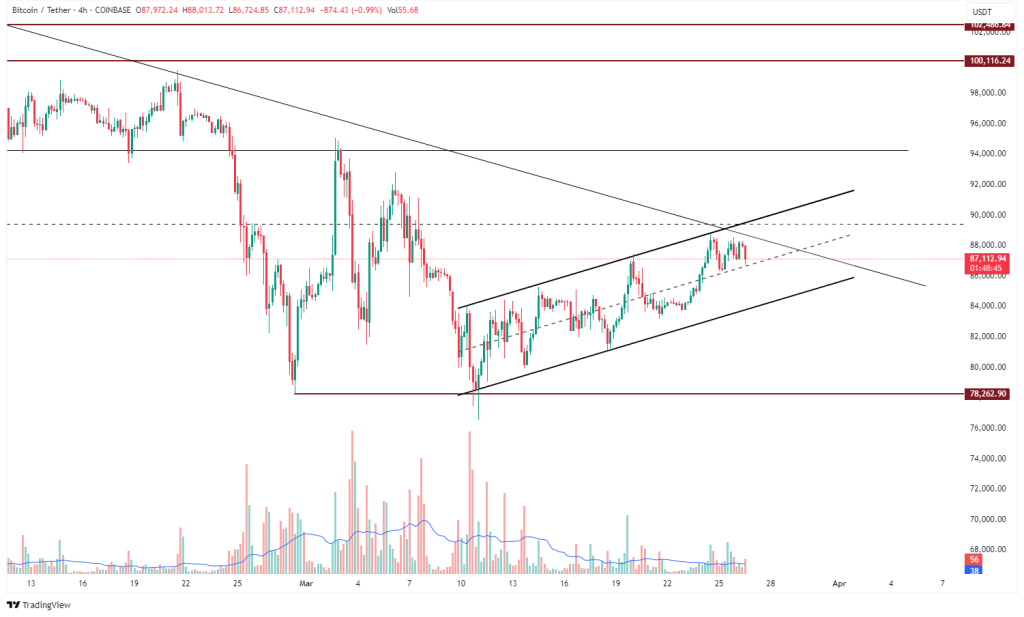
Bitcoin Trapped Between Trendlines – Can It Break Free?
Bitcoin trades near $88K resistance within an ascending channel. A breakdown below $84K could lead to a deeper correction toward $78,262.
Bitcoin (BTC/USDT) is moving inside an ascending channel, with price recently facing rejection near $88,000, where a major descending trendline intersects. This confluence of diagonal and horizontal resistance creates a strong supply zone around current levels. If price breaks below channel support near $84,000, it may trigger a deeper pullback toward $78,262, a key horizontal level. Traders are watching closely for a breakout or a trend shift within this tightening structure.
Key Levels:
- Resistance: $88,000 → $90,000
- Support: $84,000 → $78,262
US100 Cash CFD (NASDAQ) Analysis
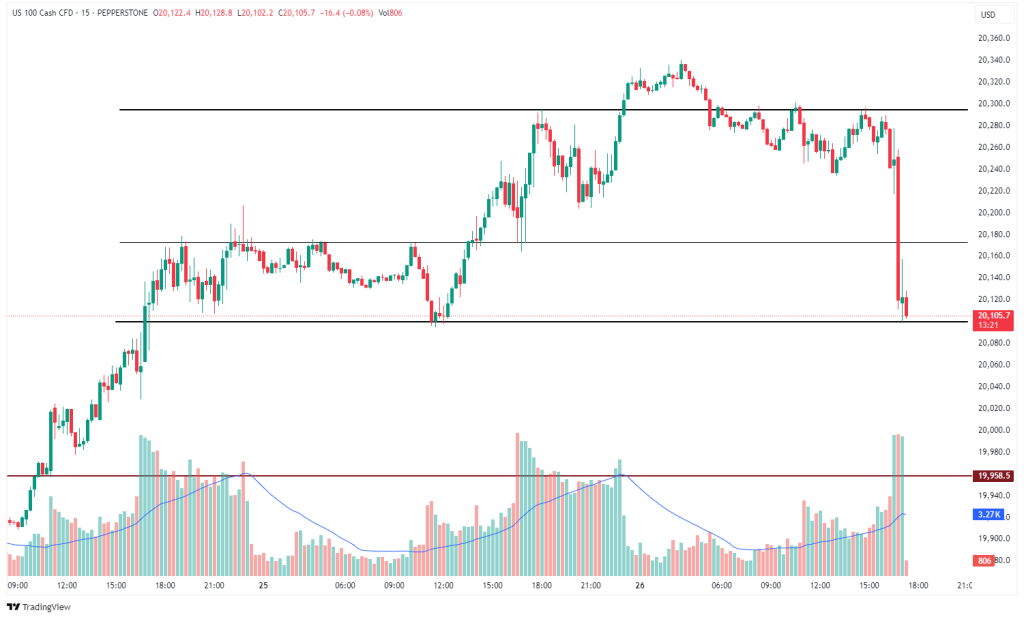
NASDAQ Slips Below Support – Is Momentum Turning Bearish?
NASDAQ breaks below 20,180 with heavy volume. If 20,100 fails, next downside levels are seen near 19,950–20,000.
NASDAQ (US100 Cash CFD) has broken below short-term support at ~20,180, with a surge in selling volume confirming bearish pressure. The breakdown from the previous range-bound structure has led price to quickly test the next support near 20,100. A failure to hold this level could expose liquidity zones around 19,950–20,000, suggesting a shift in short-term sentiment as sellers take control.
Key Levels:
- Resistance: 20,300
- Support: 20,100 → 19,950
Volatility Index (VIX) Analysis
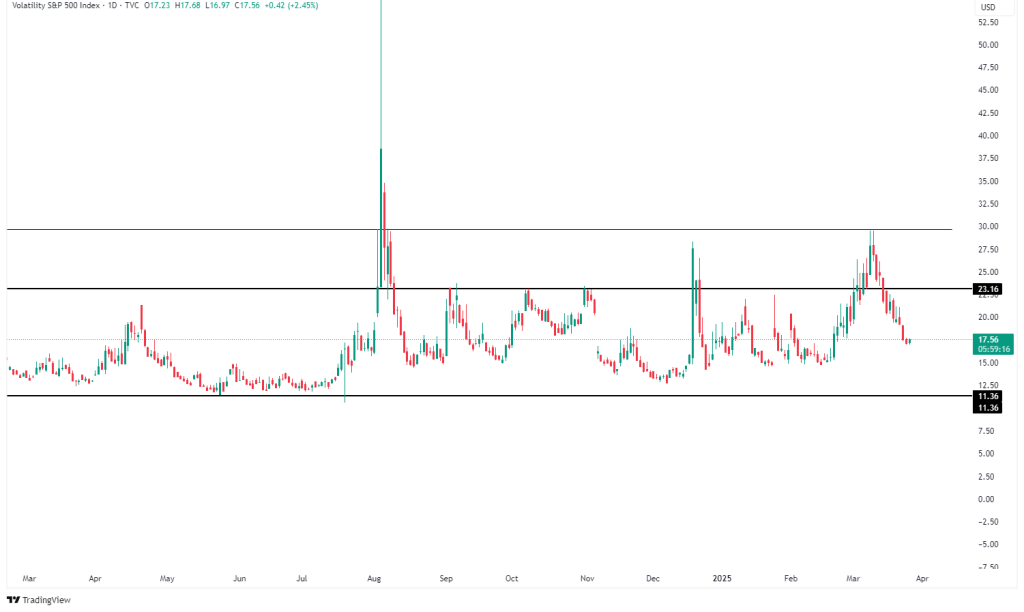
VIX has recently bounced off the support region near 16 and is now climbing toward the mid-range zone around 23. Historically, volatility spikes above this level have coincided with sharp pullbacks in broader indices.
This movement suggests increasing fear or hedging activity, often preceding or confirming equity market weakness.
Key Levels:
- Resistance: 23.16
- Support: 11.36
USD/JPY Analysis
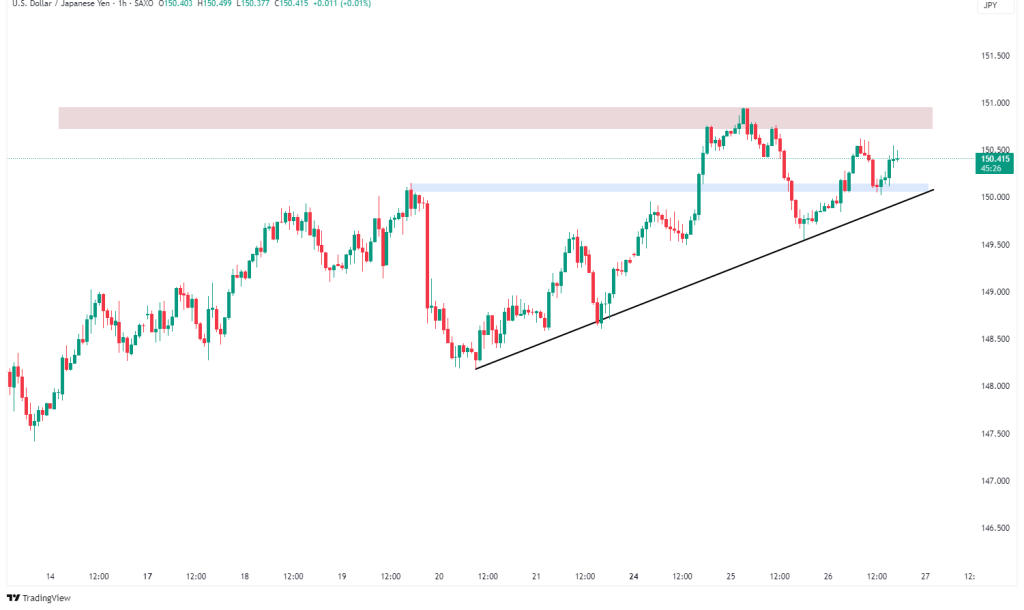
USD/JPY is respecting an ascending trendline support while consolidating below a significant resistance zone at 151. The price bounced off the trendline and minor demand zone (highlighted in blue), suggesting buyers are still active above 149.5.
A breakout above the 151 resistance could open the path for continuation of the uptrend, while a breakdown below trendline support would challenge bullish momentum.
Key Levels:
- Resistance: 151.00
- Support: 149.50 → 148.00


Leave A Comment