


This multi-asset technical analysis reviews Ethereum, the US Dollar Index (DXY), silver, and the Dow Jones Industrial Average, highlighting critical breakout and resistance levels. Ethereum has confirmed support but faces psychological resistance, DXY eyes a rebound from key support, silver shows trend exhaustion signs, and the Dow tests a multi-month ceiling that could dictate the next market move.
Multi-Asset Technical Analysis: Ethereum Price Outlook
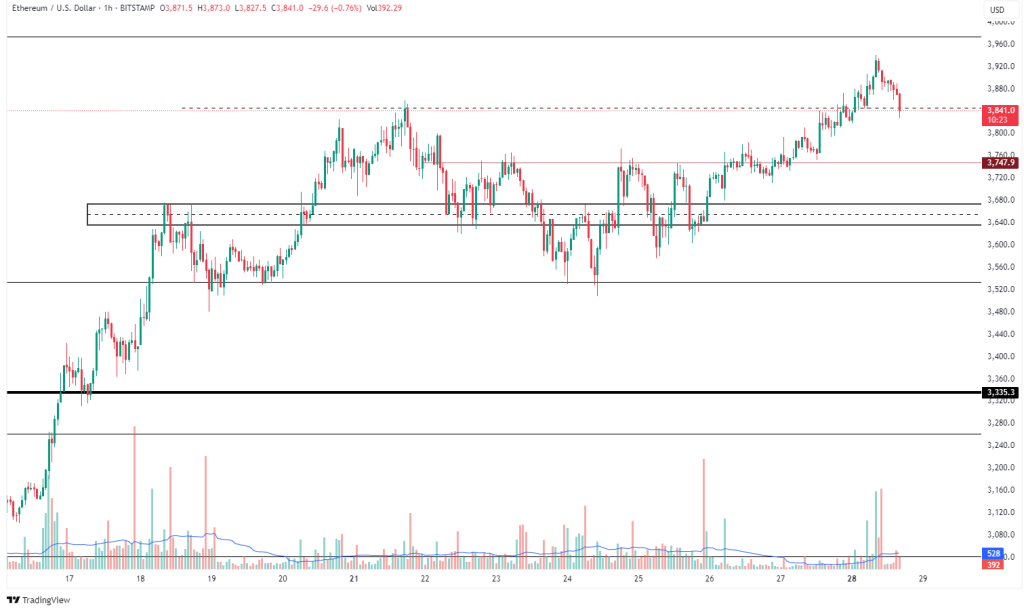
Ethereum has recently broken above the mid-term resistance zone near $3,740, confirming it as support with a successful retest. The breakout was supported by a surge in volume, indicating strong buying interest. However, price has started to stall just below the psychological level around $3,900, suggesting potential short-term profit-taking.
The previous consolidation range around $3,640 – $3,680 remains a key demand zone. A return to this level could offer a high-probability long entry if bullish momentum sustains. If bulls fail to hold this area, a further pullback to the major support at $3,335 is possible, where stronger institutional buying may re-emerge.
Multi-Asset Technical Analysis: US Dollar Index (DXY) Forecast
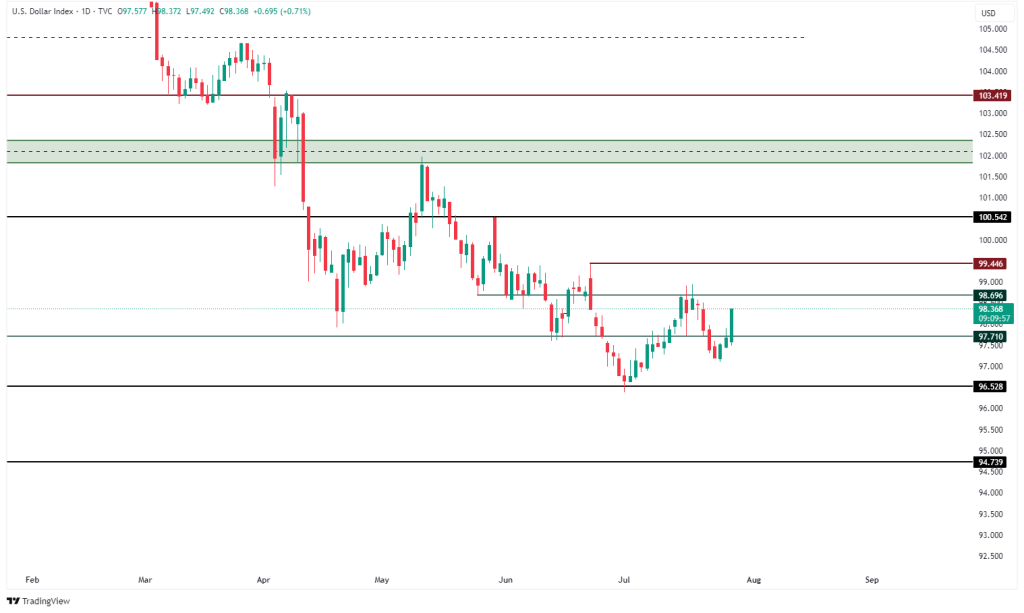
DXY is attempting a rebound from the 97.70 support level, forming a potential double bottom structure. The index is currently targeting the minor resistance at 98.69, which aligns with previous supply zones. A confirmed breakout above this level could send DXY towards 99.44, and eventually into the broader 102.00 – 103.40 resistance cluster.
Until this resistance is broken, bearish structure remains dominant in the longer term. Traders should watch the 98.69 zone closely for signs of either rejection or bullish continuation, as it may inversely impact risk assets like crypto and metals.
Silver Trend Exhaustion in Multi-Asset Technical Analysis
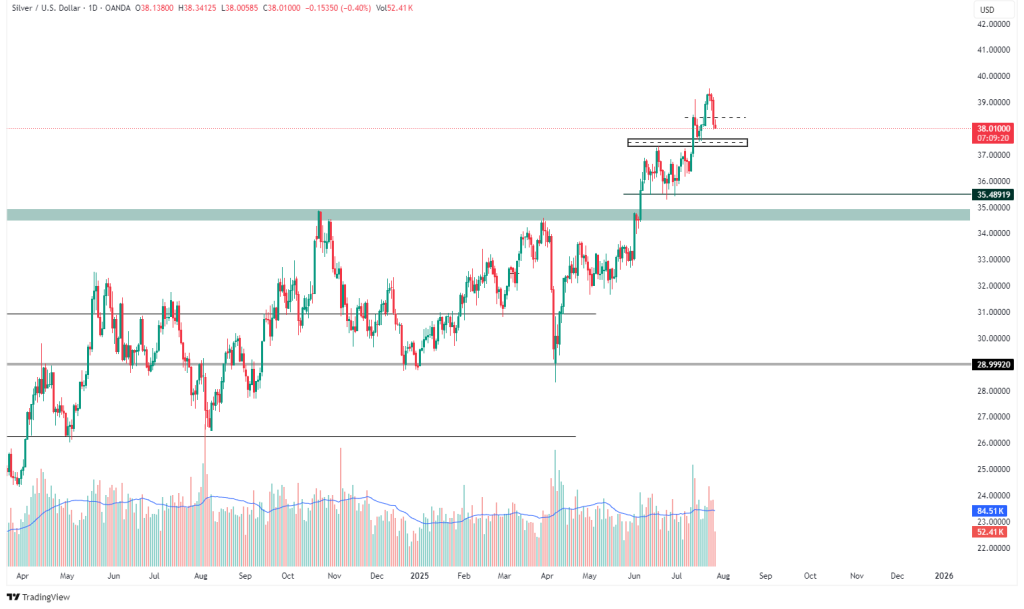
Silver is showing signs of exhaustion after rallying into multi-year highs near $39.00. A false breakout above the resistance appears to be forming, which is often a distribution signal. Price has started pulling back, with the first demand zone resting between $36.50 – $37.00.
This area will be crucial; a bounce here can renew bullish interest and retarget $40.00, while a breakdown may confirm a deeper correction toward $35.48, or even the $34.50-$35.00 macro support band. Watch for volume divergence or weakening bullish candles as early signs of trend exhaustion.
Dow Jones Faces Resistance in Multi-Asset Technical Analysis
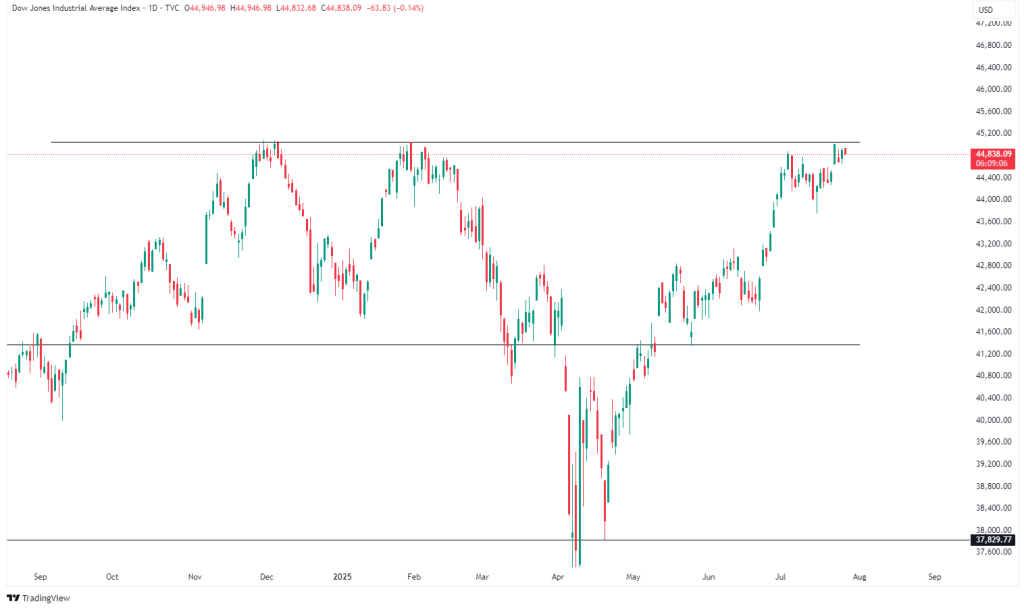
Dow Jones is testing a multi-month resistance level near 45,200, which previously rejected prices several times. The index has pushed up into this area on lower relative volume, suggesting a potential bull trap or exhaustion pattern.
A clear breakout and hold above 45,200 would signal trend continuation and open the door for a move toward new all-time highs. However, failure here could initiate a pullback toward 43,600, which aligns with the prior breakout zone and could act as a buy-the-dip level.


Leave A Comment