


This multi-asset technical signals and breakouts update highlights major moves across crypto, metals, equities, and FX. From the crypto market cap retesting 2021 highs to Silver’s strong rally, traders are watching for confirmations.
Multi-Asset Technical Signals and Breakouts: Crypto Total Market Cap
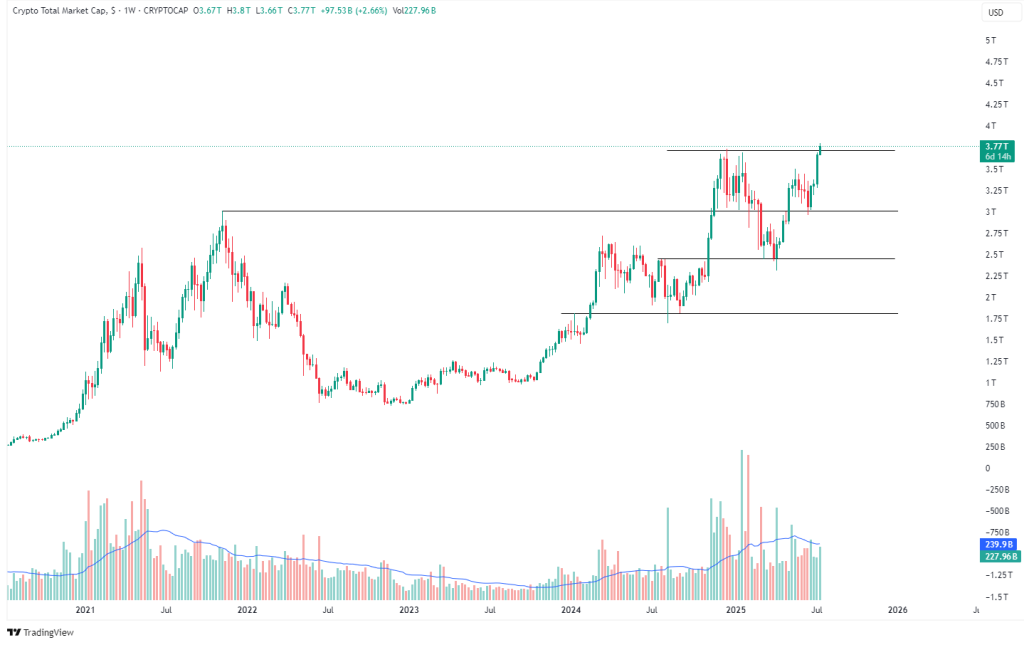
The total crypto market cap has reached a major horizontal resistance around $3.77T, a level last seen during its peak in 2021. The move to this area follows a steady uptrend beginning mid-2023, with multiple clean higher lows suggesting strong accumulation behavior.
Technical Details:
- Horizontal Resistance: $3.77T — previously rejected twice.
- Support Levels: $3.20T (mid-range), $2.65T (consolidation base), and $2.0T (major structural low).
- Volume Profile: Volume surged during the recent breakout attempt, indicating strong market participation.
- Breakout Watch: A weekly close above $3.77T with expanding volume would confirm a macro breakout, potentially opening the way toward all-time highs ($4.5T+ zone).
- Invalidation: Breakdown below $3.20T would signal a failed breakout and potential retracement.
Multi-Asset Technical Signals and Breakouts: Silver Price Action
Structure & Trend:
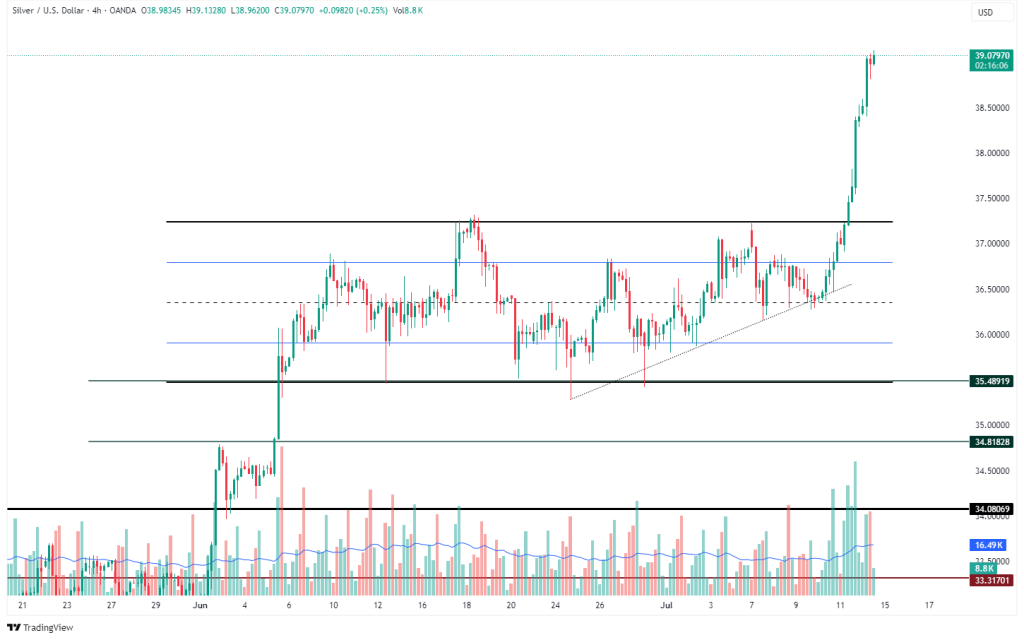
Silver has recently broken out of a consolidation box, triggered by a steep rally past the $37.50 resistance. Price action over the last few weeks formed an ascending triangle, which has now resolved to the upside with strong bullish momentum.
Technical Details:
- Breakout Level: ~$37.50 — now turned support.
- Current Resistance: Minor supply expected near $39.50–$40.
- Support Levels: $36.50 (dotted trendline), $34.80, and $35.48.
- Volume Spike: A massive increase in volume validates the breakout and indicates institutional interest.
- Next Target: If $39.50 is breached, the next measured move projects toward $41.50 based on triangle height.
Dow Jones All-Time High Compression
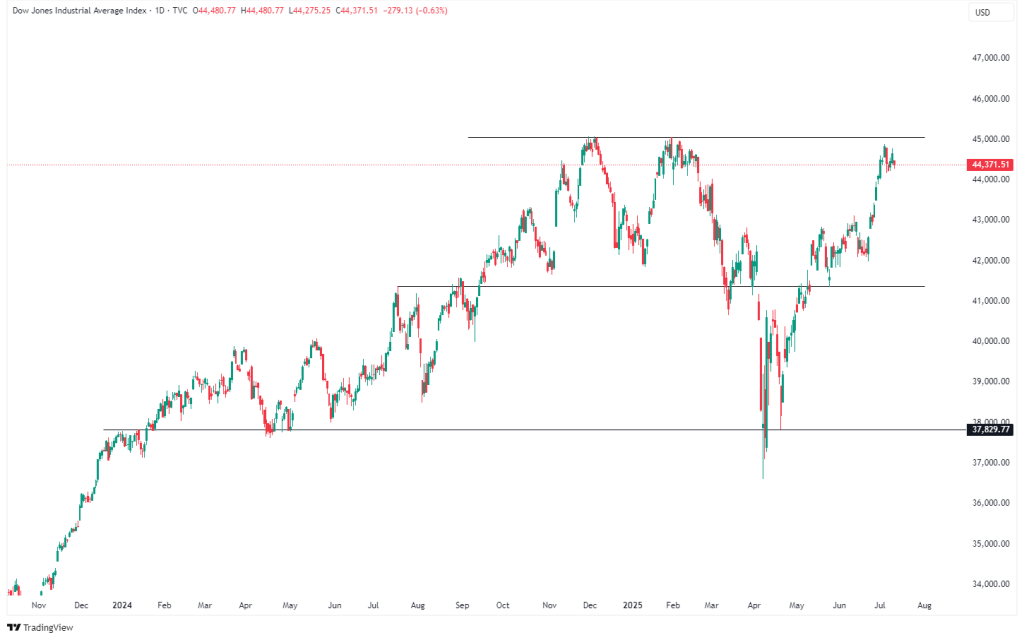
The Dow is once again challenging its historical all-time high resistance near 45,000. Price action is compressing just below this level, which may lead to a breakout — or a double top rejection depending on momentum.
Technical Details:
- Resistance: ~$45,000 — tested multiple times.
- Support: $41,300 (prior breakout level) and $37,800 (macro base).
- Price Behavior: The current daily candles show decreasing momentum — potential consolidation or distribution.
- Scenario: A breakout could initiate a trend continuation toward 46,000–47,000. A rejection could lead to a drop back toward $42,000 for retesting demand.
USD/JPY Symmetrical Triangle Setup
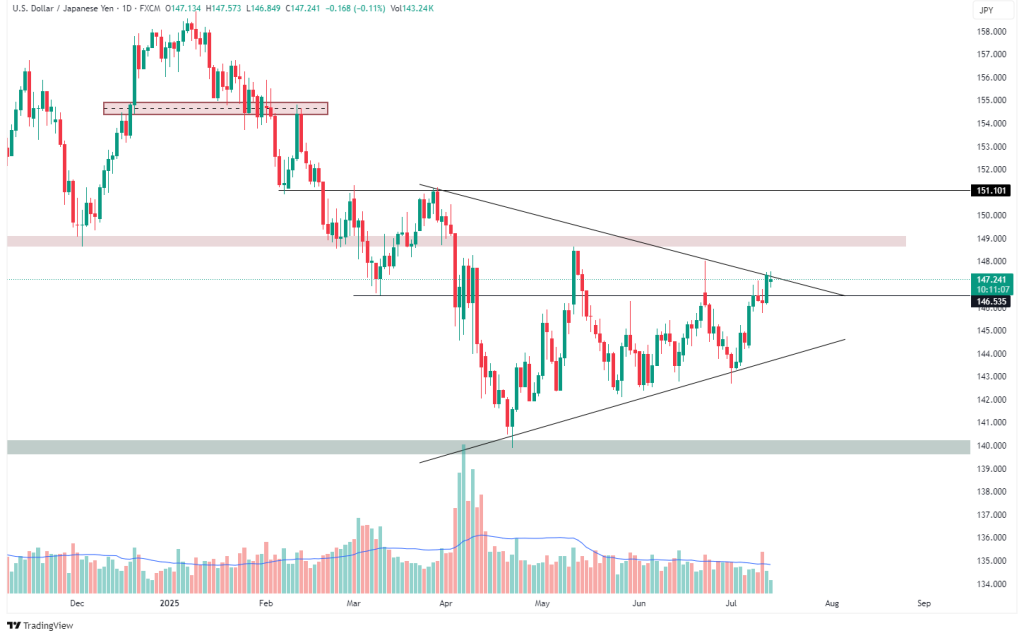
USD/JPY is forming a symmetrical triangle (coil) just under a key descending trendline from 2024 highs. This chart is a textbook case of a squeeze setup, where momentum builds as price converges between higher lows and lower highs.
Technical Details:
- Triangle Breakout Attempt: Price is currently testing the upper trendline (~147.20). A confirmed breakout could target 149.50 first, then 151.10.
- Key Resistance: 148.50–151.10 zone, reinforced by previous breakdown area.
- Support Trendline: Rising trendline from May lows (~144.50).
- Volume: Still muted; real confirmation requires an accompanying volume expansion.
- Bearish Rejection Risk: If rejected, price could fall back to test the 143.00–144.00 zone.


Leave A Comment