

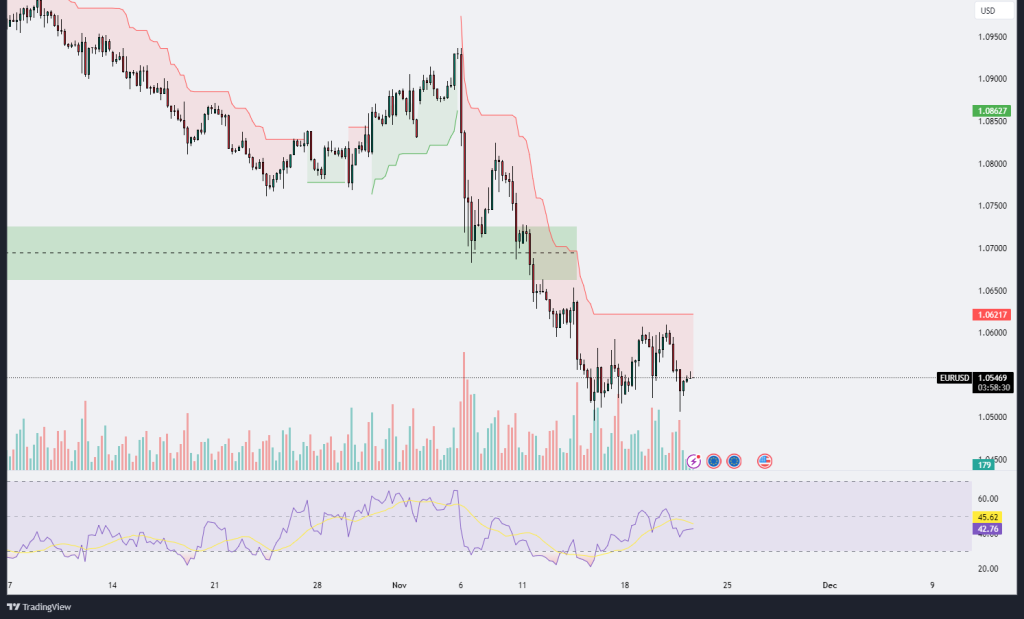
EURUSD
The EUR/USD chart highlights a clear downtrend, with the price currently trading around 1.05464, consolidating within a tight range below the 1.06217 resistance level. The bearish momentum, which had driven the price sharply lower from the 1.08627 level, has slowed down as the market enters a phase of sideways movement. The presence of the red Ichimoku cloud above the price action confirms the prevailing bearish sentiment, as the pair struggles to gain upward traction. Additionally, the price remains well below the green support zone around 1.06800, further reinforcing the bearish outlook.
Volume analysis shows a noticeable decline during the consolidation phase, indicating reduced trading activity and indecision among participants. This low volume aligns with the RSI, which is hovering just above the oversold territory near 42.59, reflecting the lack of momentum to push prices significantly in either direction. However, the RSI is showing signs of stabilization, suggesting the potential for a short-term bounce or a retest of the 1.06217 resistance level.
From a technical perspective, the 1.06217 resistance serves as a critical barrier for bullish attempts. A breakout above this level, supported by increased volume, could indicate a shift in sentiment and a potential recovery toward higher levels, such as 1.07000. Conversely, if the price fails to overcome this resistance, the bearish trend is likely to resume, with the pair potentially targeting the psychological support around 1.05000 or even lower. Traders should closely monitor any signs of breakout or breakdown, as well as external catalysts, to gauge the next significant move.
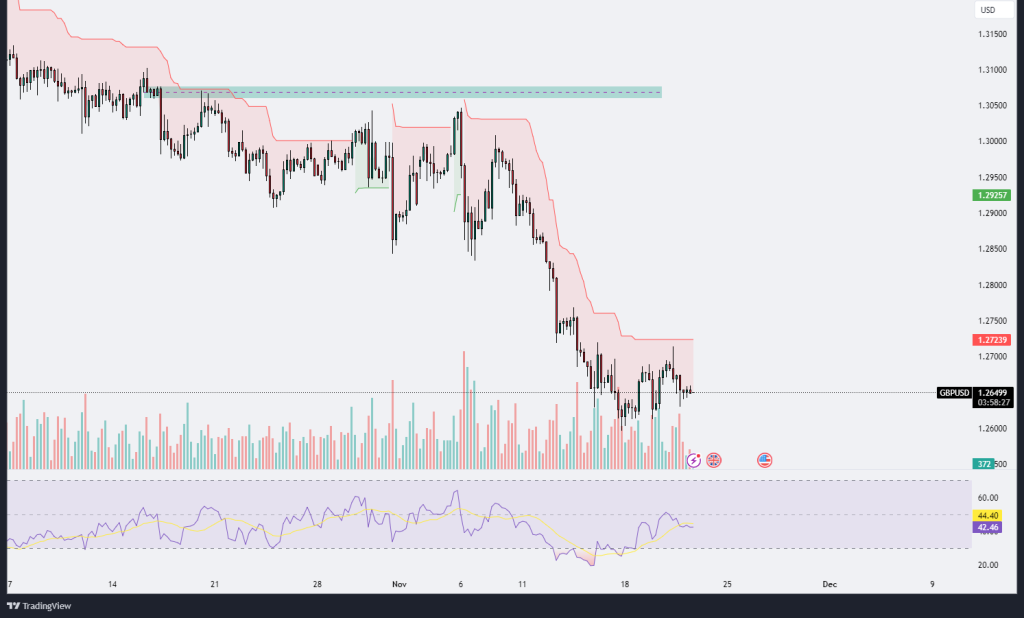
GBPUSD
The GBP/USD chart showcases a clear downtrend over the past several weeks, with the price consistently printing lower highs and lower lows. The red shaded area above highlights the bearish control zone, where sellers have been actively capping any potential upside retracements. Recent price action suggests that the pair has entered a consolidation phase near the 1.2650 level, with the price struggling to gain directional momentum after a significant decline. The volume appears subdued, indicating a lack of strong conviction among traders at these levels. The resistance zone near 1.2720 remains unbroken, emphasizing the challenge for bulls to regain control. On the downside, further weakness could drive the pair toward the psychological support at 1.2600, and a break below this level might open the door to further declines. Meanwhile, the RSI indicator remains below the midline, suggesting bearish momentum still dominates, though some flattening hints at potential stabilization or a short-term corrective move. Overall, the pair’s current position reflects hesitation, with sellers maintaining the upper hand but lacking strong follow-through. A break of either the resistance or support levels could determine the next significant move for the pair.
XAUUSD
The XAU/USD chart illustrates a strong rebound after a pronounced sell-off in the earlier period, with the price recovering from a critical support zone around $2,601-$2,621. This green-highlighted area represents a key demand zone where buyers stepped in aggressively, leading to a bullish reversal. The recent rally has pushed prices back above $2,650, signaling a potential continuation of the recovery trend. The move is supported by increasing volume, indicating renewed buying interest. However, the price is now nearing a previous resistance level, as indicated by the red zone above, where sellers previously exerted significant pressure. If gold manages to break and sustain above this resistance, it could target the next higher levels around $2,700-$2,720. On the other hand, failure to overcome this level might lead to a retracement, testing the support at $2,621 once again. The overall market sentiment appears cautiously optimistic, with the bulls gaining short-term control, but further confirmation is needed to establish a clear upward trend.

XAGUSD
The XAG/USD (Silver/USD) chart shows the price attempting to stabilize after a significant downtrend. The current price action indicates consolidation near the $31.14 level, with the price finding short-term support around $30.45. The Ichimoku cloud suggests a neutral to slightly bearish sentiment, as the price has struggled to decisively break above the resistance zone created by the upper bounds of the cloud. The declining volume in recent sessions reflects a lack of conviction among traders, signaling hesitation to commit to either a bullish or bearish move.
If silver can push above the recent highs and sustain above the $31.50 level, it could signal a reversal, with the next target being the $32.50 to $33.00 resistance area. However, failure to break above this level may lead to a retest of the $30.45 support zone, and a breakdown below that level could drive the price toward $30.00 or lower. The RSI indicator is currently hovering near the midline, reflecting indecisiveness in momentum. Traders should watch for a directional breakout accompanied by strong volume as a signal for the next major move. For now, the market remains in a consolidation phase, and caution is advised.


Leave A Comment