

AUDCAD
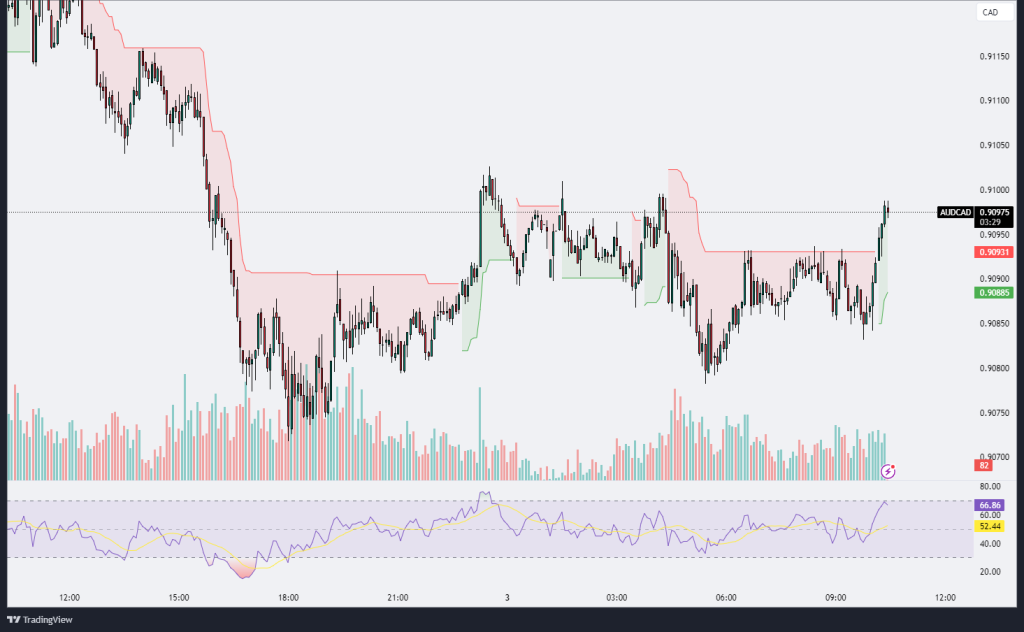
The AUD/CAD chart reflects a notable bullish recovery after a prior period of consolidation within a narrow range. The pair has successfully broken above the Ichimoku cloud resistance, signaling a potential shift in market sentiment from bearish to bullish. The price currently hovers around 0.9097, testing the recent intraday high, which could act as a short-term resistance. The RSI has surged above 60, currently at 66.56, indicating strong bullish momentum but also approaching overbought territory. Volume levels have increased during the upward move, providing confirmation of the breakout and suggesting that buyers are actively participating.
If the bullish momentum sustains, the next resistance level to watch is around 0.9110, where previous price action indicates potential supply. A break above this level could open the door for further gains toward 0.9150. Conversely, if the price faces rejection at the current resistance, it may retest the support zone near 0.9080, which aligns with the upper boundary of the Ichimoku cloud and previous consolidation levels. The trend is cautiously bullish, and traders should monitor the RSI closely for signs of divergence or overbought conditions that may indicate a pullback. Overall, the AUD/CAD is showing signs of recovery, with further upside potential if key resistance levels are breached.
AUDUSD
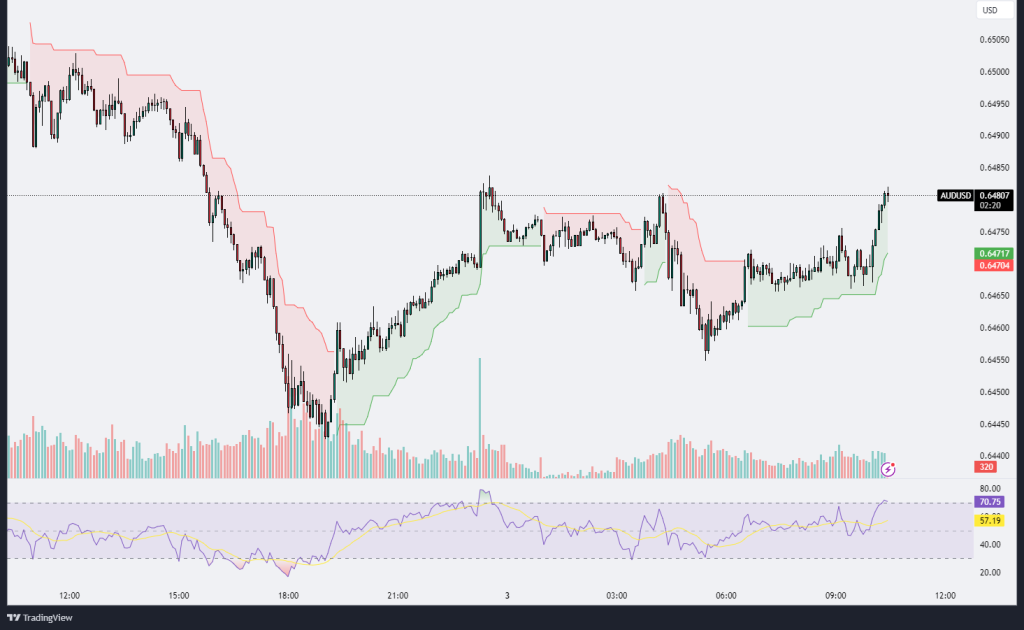
The AUD/USD chart displays a strong bullish recovery, with the price breaking above the Ichimoku cloud, signaling a potential reversal from the recent downtrend. The current price is around 0.6485, which represents a key level as it approaches the intraday highs. The RSI has moved above 70, entering overbought territory, indicating strong bullish momentum but cautioning against a potential pullback. The increase in volume during the upward movement suggests active buying interest, confirming the breakout.
The pair’s next resistance level is likely around 0.6500, a psychological level and a potential point of profit-taking for bulls. A sustained move above this level could target higher zones near 0.6520. On the downside, immediate support is found near 0.6470, around the upper boundary of the Ichimoku cloud. If the price falls below this support, the pair may retest the consolidation zone near 0.6450.
Overall, the AUD/USD shows bullish potential, driven by strong momentum and increasing volume. However, the RSI’s overbought condition warrants caution, and traders should watch for any signs of exhaustion or pullback at current levels. A continuation above 0.6500 could confirm further upside, while a drop below 0.6470 may signal a temporary correction.
EURGBP
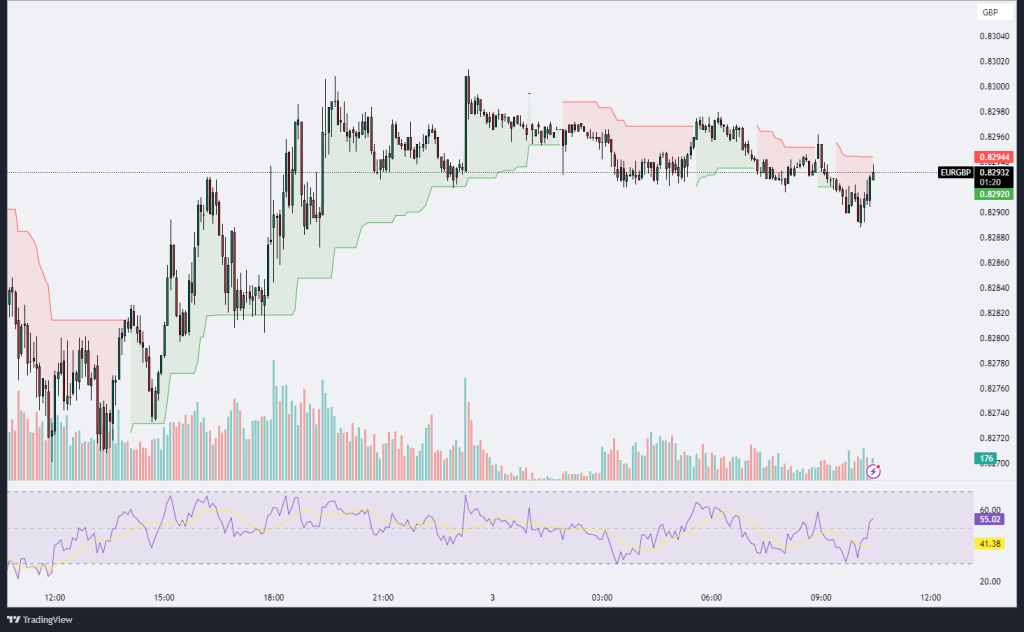
The EUR/GBP chart shows a period of range-bound trading, with the pair fluctuating between support around 0.8280 and resistance near 0.8300. Recent price action indicates a slight upward momentum as the price has risen back toward the Ichimoku cloud’s resistance zone. This suggests a potential attempt to break out of the range. However, the cloud’s resistance level at 0.8295 serves as a critical barrier, as a breakout above it could signal a shift toward bullish momentum.
The RSI is climbing from the 40 level, currently at 55, indicating improving bullish momentum but not yet entering overbought territory. This suggests that there may be more room for the pair to rise, provided it can sustain the upward push. Volume activity remains relatively low, indicating that while the pair is attempting to regain higher levels, conviction from market participants is still cautious.
For a bullish continuation, the price needs to close decisively above the cloud resistance and the 0.8300 psychological level. A breakout could target the next resistance around 0.8320. On the downside, a failure to breach the cloud and a decline below 0.8280 could see the pair retesting lower levels, potentially revisiting the recent low near 0.8270. The market remains indecisive, with a slight bias toward a bullish breakout if momentum persists.
EURJPY
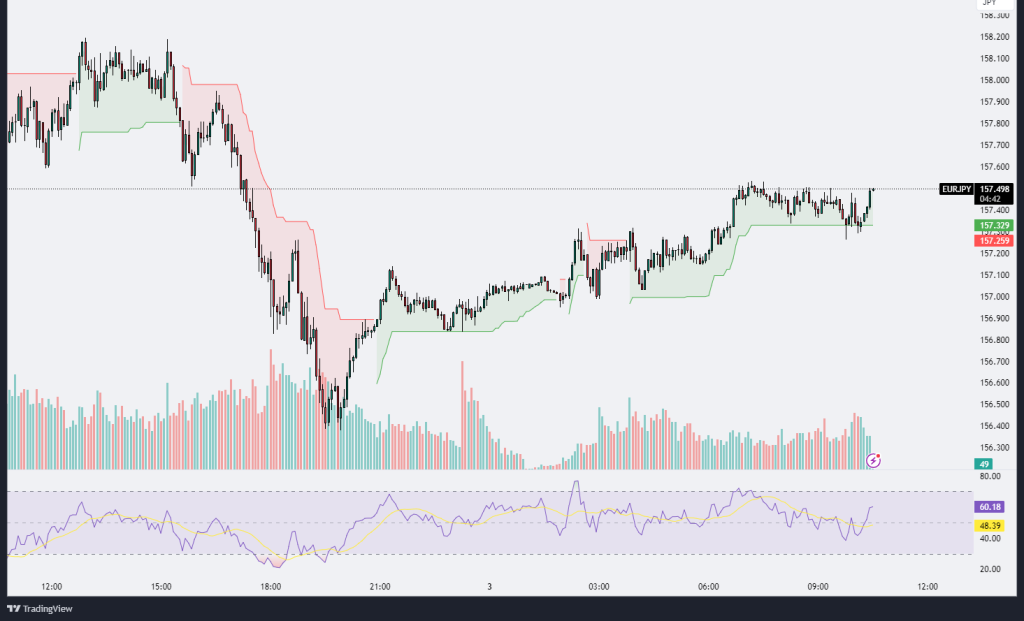
The EUR/JPY chart showcases a recovery from a recent bearish move, with the price climbing back into a consolidation range near the 157.50 level. The Ichimoku cloud provides support for the bullish sentiment, with the price trading above the green cloud, suggesting a potential continuation of upward momentum. The upward trajectory is further supported by the RSI indicator, which has crossed the 60 level, reflecting increased bullish strength but still below overbought conditions, implying room for further upside.
Volume analysis reveals a gradual increase in trading activity, signaling that the recent price action is gaining market participation. The consolidation phase between 157.25 and 157.50 indicates that the pair is preparing for a potential breakout. A decisive close above 157.50 could pave the way for further gains toward the next resistance level, possibly around 158.00. Conversely, a failure to maintain the current momentum and a drop below 157.25 could signal a retest of the lower support zones near 157.00.
Overall, the pair is showing signs of bullish continuation, with buyers reclaiming control in the short term. However, confirmation of the breakout and sustained momentum will be critical to determining the next directional move.


Leave A Comment