

Market Outlook: EUR/USD & GBP/USD Hold Bullish Structure, Gold & Silver Face Pullback
EURUSD
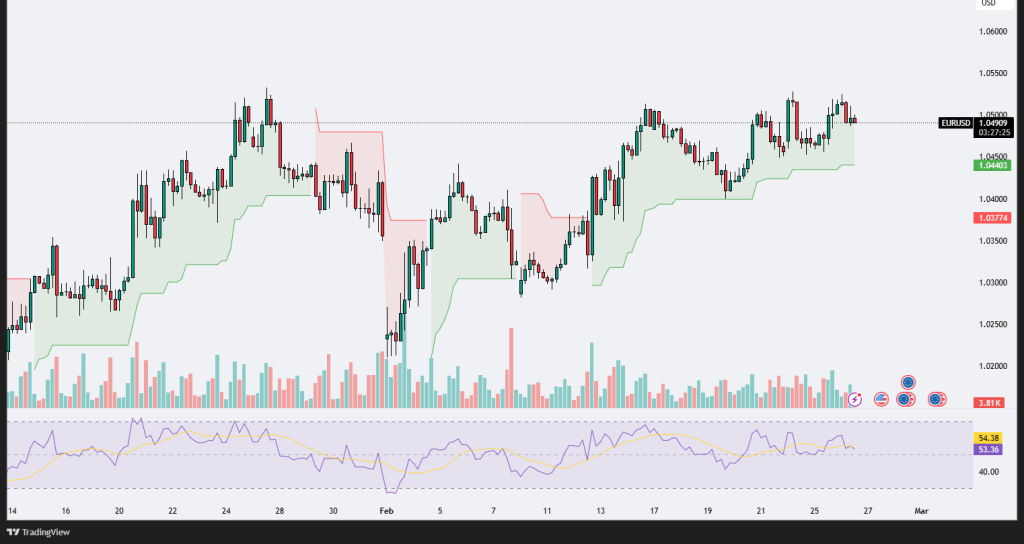
The EUR/USD pair is currently exhibiting a bullish structure, trading around 1.04912, with the Supertrend indicator signaling ongoing buying pressure as the price remains above the green support zone. The trend appears to be upward, characterized by higher highs and higher lows, though some consolidation is visible at current levels. A breakout above the 1.0550 resistance could lead to further upside towards 1.0600, while immediate support is seen at 1.0440, with a deeper retracement potentially targeting 1.0377. The RSI at 54.39 suggests mild bullish momentum without overbought conditions, indicating room for further gains if momentum strengthens. If the RSI pushes above 60-65, it could confirm a breakout, whereas a drop below 50 may signal weakening momentum and possible pullback. In summary, EUR/USD remains in a bullish trend, but traders should watch for a breakout above 1.0550 or a potential retracement towards 1.0377 depending on momentum and market conditions.
GBPUSD
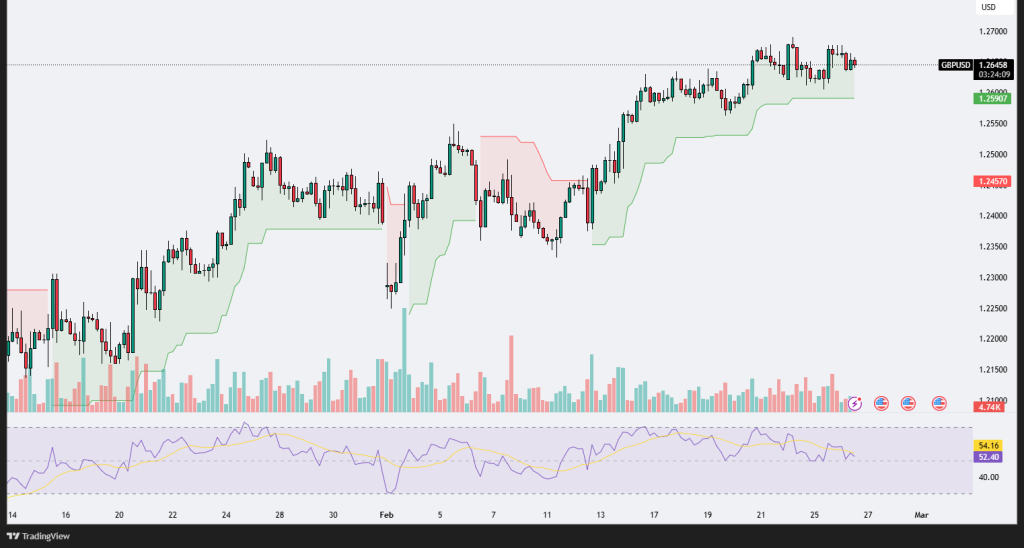
The GBP/USD pair is trading around 1.26457, exhibiting a consolidation phase after a strong uptrend. The Supertrend indicator remains bullish, with price action staying above the green support zone, suggesting continued upside potential. However, the recent sideways movement indicates that the market is in a range-bound state, awaiting a breakout. The key support level lies around 1.2590, where previous price reactions have taken place, while immediate resistance is around the 1.2700 psychological level. A decisive break above this resistance could fuel further bullish momentum toward 1.2750, whereas a drop below 1.2590 could lead to a correction towards 1.2457. The RSI indicator is currently at 54.16, reflecting mild bullish momentum but without strong overbought signals, meaning there is still room for price expansion. However, if RSI falls below 50, it may indicate weakening momentum, increasing the risk of a downside retracement. Volume appears moderate, suggesting a wait-and-see approach by traders, possibly anticipating key economic data or a catalyst for a stronger move. Overall, GBP/USD remains in a bullish structure, but a breakout from the current consolidation zone is needed for confirmation of the next directional move.
XAUUSD
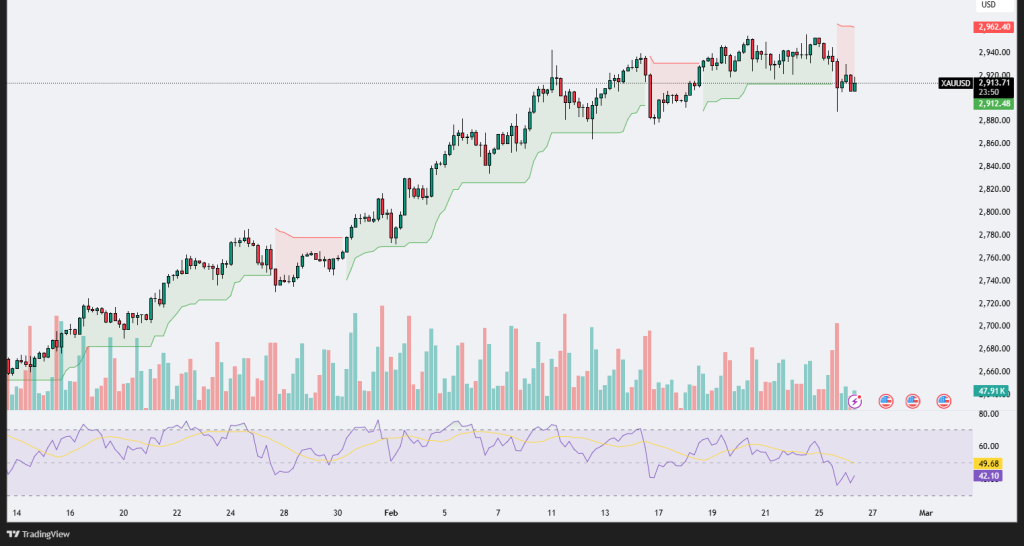
The XAU/USD (Gold) chart shows a strong bullish trend that has been in place for several weeks, with a series of higher highs and higher lows. However, recent price action indicates a potential short-term correction, as the price has dipped slightly from its recent peak of $2,962.40 to around $2,913.74. The Supertrend indicator remains bullish overall, but a red cloud has started to appear, signaling possible weakness or consolidation. The price is currently testing support near $2,912.48, which is a critical level to watch. If this support holds, it could act as a springboard for another upward move. However, a break below this level might trigger further downside toward $2,880 or even $2,850 in the short term.
The Relative Strength Index (RSI) has fallen to 42.11, indicating that momentum is shifting downward and approaching oversold territory. If the RSI drops below 40, it could further confirm bearish momentum. On the other hand, a rebound from this level could indicate buyers stepping back in. Volume has also picked up recently, suggesting increased market activity, possibly due to profit-taking after the recent strong rally.
Overall, the long-term trend remains bullish, but in the short term, gold is experiencing a pullback or consolidation phase. Traders should watch for either a bounce from the current support levels to confirm a continuation of the uptrend or a further breakdown, which could lead to deeper retracements. Key resistance to watch remains at $2,950–$2,962, while support is seen at $2,912 and $2,880.
XAGUSD
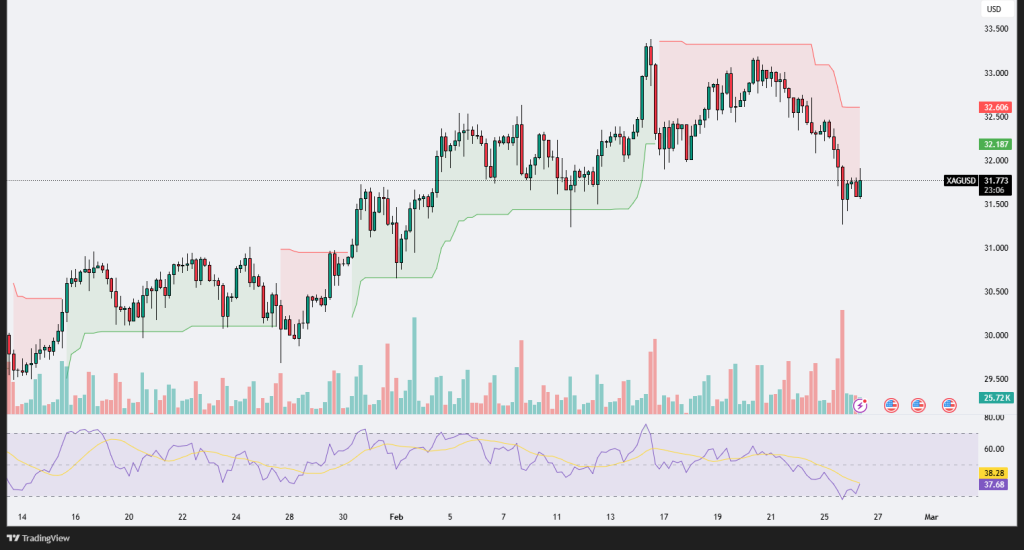
The XAG/USD (Silver) chart shows a notable pullback after a strong bullish run, indicating a shift in momentum. Silver reached a peak near $33.50 but has since dropped sharply to $31.77, with increasing bearish momentum. The price is now hovering around the $31.50-$32.00 support zone, attempting to stabilize after a period of significant selling pressure. The Supertrend indicator has turned red, reflecting bearish sentiment in the short term, and price action suggests a break below previous higher lows, which could signal further downside if support fails to hold.
The Relative Strength Index (RSI) currently sits at 37.59, approaching oversold territory. If it drops below 30, it could indicate extreme bearish conditions, potentially leading to a short-term rebound. However, a failure to reclaim higher levels may continue the selling pressure. Volume has spiked, suggesting strong participation from sellers, further reinforcing the bearish bias. The key levels to watch include support at $31.50, which, if broken, could lead to further declines toward $30.80 or even $30.00. On the upside, resistance at $32.60-$33.00 must be reclaimed for bulls to regain control.
Overall, Silver is in a corrective phase, and while a short-term bounce is possible due to the RSI nearing oversold conditions, the broader structure remains weak. A decisive break below $31.50 could accelerate losses, while a reclaim of $32.60+ could suggest renewed bullish momentum. Traders should remain cautious and watch for confirmation signals before positioning for the next move.
.png)

.png)


