


GBPUSD Analysis
GBP/USD Consolidates Below 1.3425 – Breakout Imminent?
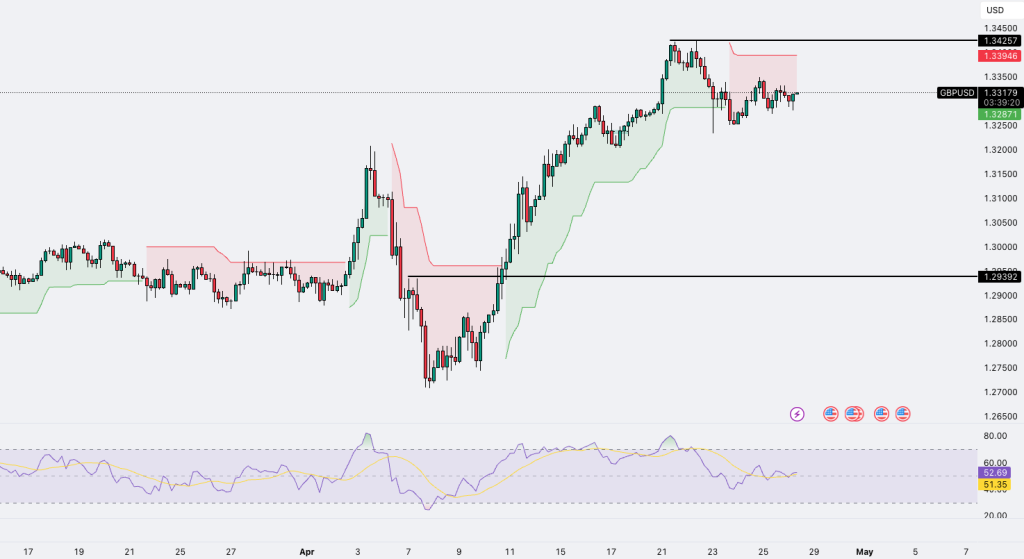
GBP/USD compresses between 1.3287–1.3394. RSI at 52.69 signals consolidation. Breakout above 1.3425 could resume bullish trend; breakdown eyes deeper pullback.
GBP/USD has been consolidating below the 1.3350 resistance zone after a strong uptrend that began in mid-April. Price is ranging between 1.3287 and 1.3394, with compression building under 1.3425, a critical resistance line. The trend-following cloud zones (green/red) indicate that a bullish structure is challenged by a neutral consolidation phase. The RSI sits at 52.69, reinforcing a lack of directional momentum. A breakout above 1.3425 could resume bullish continuation, while a breakdown below 1.3287 may trigger a deeper corrective move.
EURUSD Analysis
EUR/USD Compresses Below 1.1406 – Breakout or Breakdown?
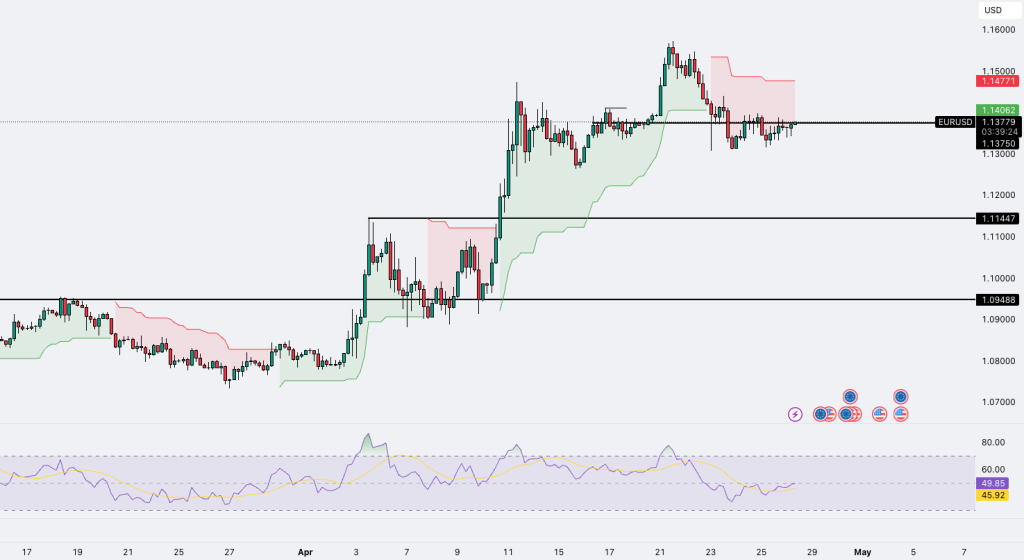
EUR/USD trades between 1.1144–1.1406 after early April rally. RSI at 49.85 shows indecision. Breakout above 1.1406 or breakdown below 1.1375 in focus.
EUR/USD mirrors GBP/USD’s compression structure, trading just below the 1.1406 resistance after a bullish rally from early April. Price is trapped between 1.1144 support and 1.1406 resistance, with upside capped by sellers. The SuperTrend indicator has flattened, hinting at a neutral-to-slightly bearish shift, while the RSI at 49.85 reinforces the lack of strong momentum. A daily close above 1.1406 could spark renewed buying interest, but a drop below 1.1375 may expose the pair to a deeper retracement toward 1.1144.
XAGUSD Analysis
Silver (XAGUSD) Slips Below 33.10 – Bearish Tilt Grows
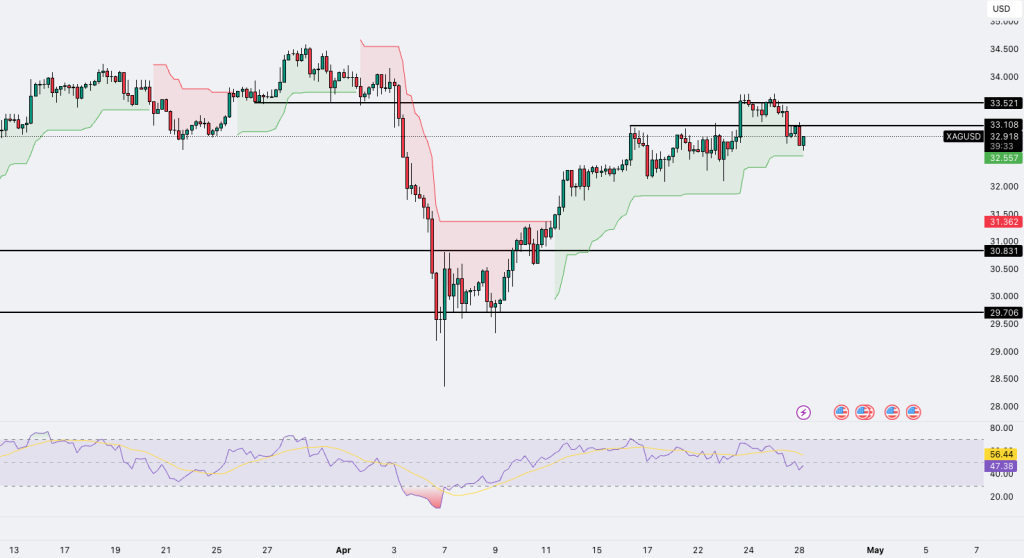
Silver breaks below 33.10 and weakens toward 31.36 support. RSI at 47.38 signals fading momentum. Bulls must reclaim 33.50 to regain control.
Silver (XAGUSD) shows relative weakness compared to major currency pairs, breaking below minor support at 33.10 and testing the lower bounds of its bullish trend zone. Failure to sustain above 33.50 resistance reflects exhaustion in bullish momentum. The RSI around 47.38 signals a drift toward bearish territory, though without a strong oversold indication yet. If weakness continues, major support at 31.36 could be retested. A reclaim of 33.50 is critical to negate the current bearish bias.
XAUUSD Analysis
Gold (XAUUSD) Slides Into Correction – Key Levels to Watch
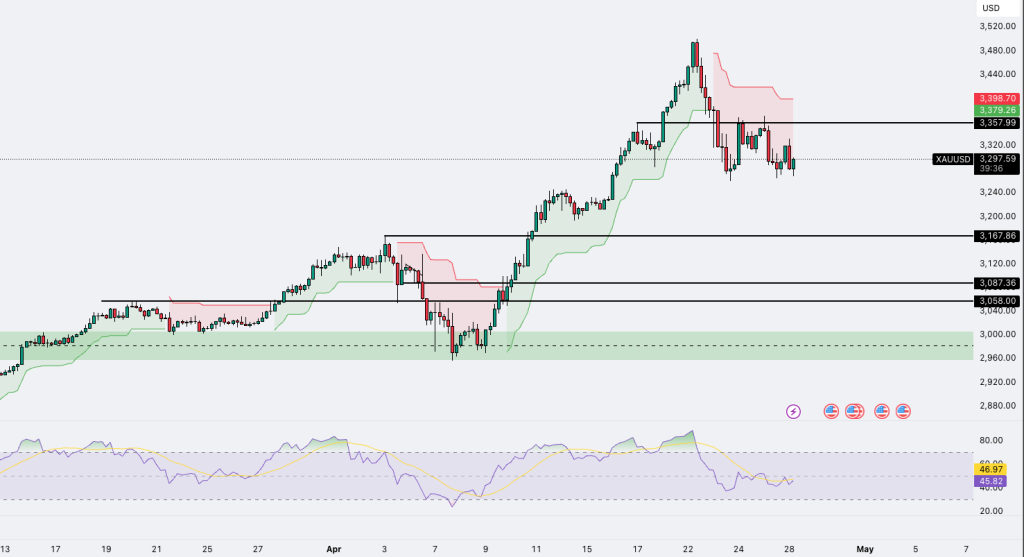
Gold shifts into bearish correction phase below 3,357. RSI at 45.82 shows fading strength. Watch 3,297 and 3,167 as next critical support zones.
Gold (XAUUSD) has entered a bearish correction phase after peaking near 3,480. The price structure now displays lower highs and lower lows within a short-term range between 3,357 and 3,167. The red SuperTrend zone overhead acts as a dynamic resistance ceiling, capping price advances. The RSI trending at 45.82 signals waning bullish strength without reaching oversold levels yet. If 3,297 support breaks, the next critical downside target will be 3,167. A daily close above 3,357 would be needed to recover bullish momentum.


Leave A Comment