


These technical trading insights explore key setups across commodities, currencies, and crypto. Copper breaks out with strong volume, DXY hovers near resistance, Ethereum coils within a defined range, and Gold remains in consolidation.
Technical Trading Insights: Copper Analysis
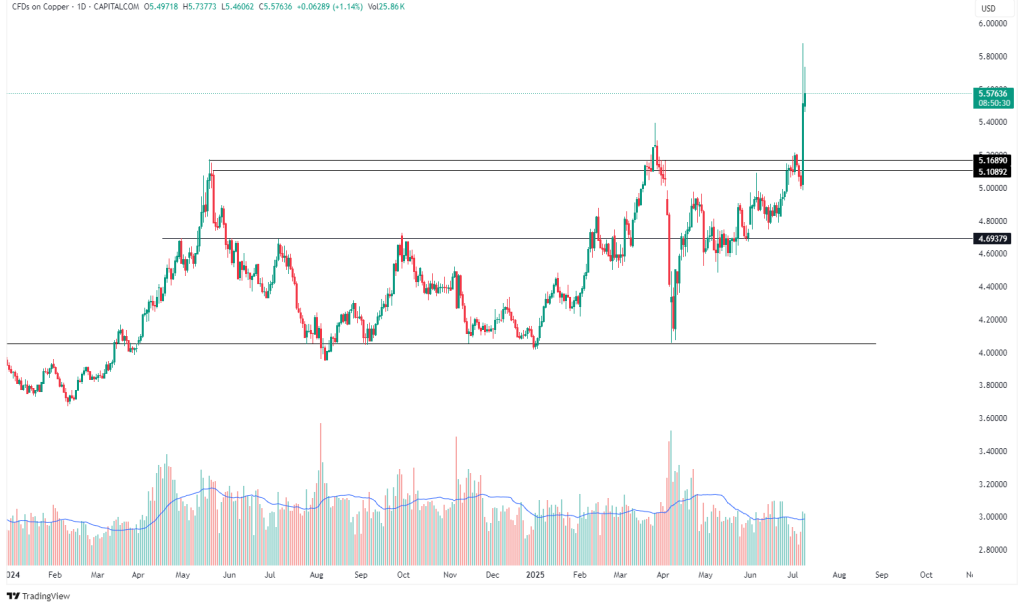
Copper has broken out powerfully above its previous resistance zone, clearing both $5.10 and $5.17 levels in one strong move. The breakout is backed by rising volume, suggesting real momentum behind the rally. With price now approaching $5.58, the market is entering a potential overbought area in the short term. However, there is no immediate sign of weakness, and the bullish structure remains intact. Any pullback toward the $5.17–$5.10 region would likely be seen as a healthy retest of the breakout area, offering a potential re-entry point for trend followers. If bullish momentum continues, the next psychological target could be around the $6.00 handle.
Techniques Used: Breakout analysis, volume confirmation, retest expectation
- Trend: Strong bullish breakout confirmed
- Structure: Price surged above previous highs of $5.17 and $5.10, now testing the psychological $5.57–$5.60 area
- Volume: Bullish volume confirms breakout strength
- Outlook: Momentum suggests continuation possible, but overextension could lead to a retest of breakout zone ($5.17–$5.10) before continuation
Technical Trading Insights: U.S. Dollar Index (DXY)
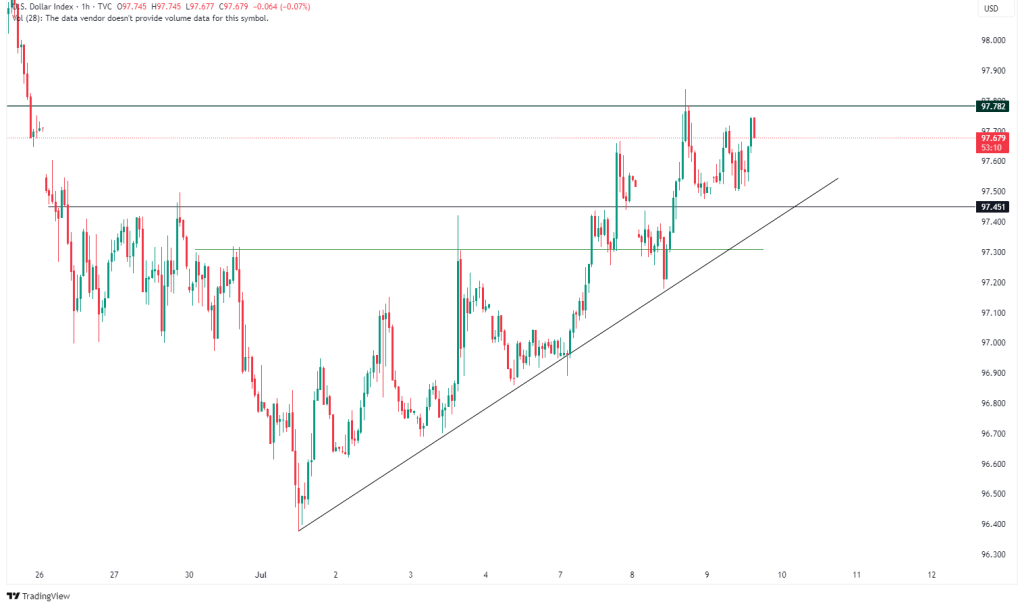
The U.S. Dollar Index has been trending upward, forming a clear series of higher lows supported by a well-defined ascending trendline. Currently, price is hovering just below a key resistance level at 97.782. This level has acted as a barrier on multiple occasions, and the current price action shows indecision right beneath it. The ascending structure suggests bullish intent; however, without a decisive breakout above this resistance, upside potential may be limited. If rejected again, price could fall back toward the 97.451 level or the rising trendline. Momentum remains constructive as long as the trendline holds, but a confirmed close above 97.782 is needed for continuation toward 98.00 and beyond.Trend: Short-term uptrend remains intact with higher lows.
- Structure: Price is forming an ascending triangle with a horizontal resistance around 97.78
- Support: Rising trendline and prior horizontal level near 97.45
- Outlook: A breakout above 97.78 may accelerate bullish momentum. Failure to do so could lead to a short-term correction back to the trendline
- Techniques Used: Ascending triangle pattern, support/resistance analysis
Ethereum / USDT (ETHUSDT)
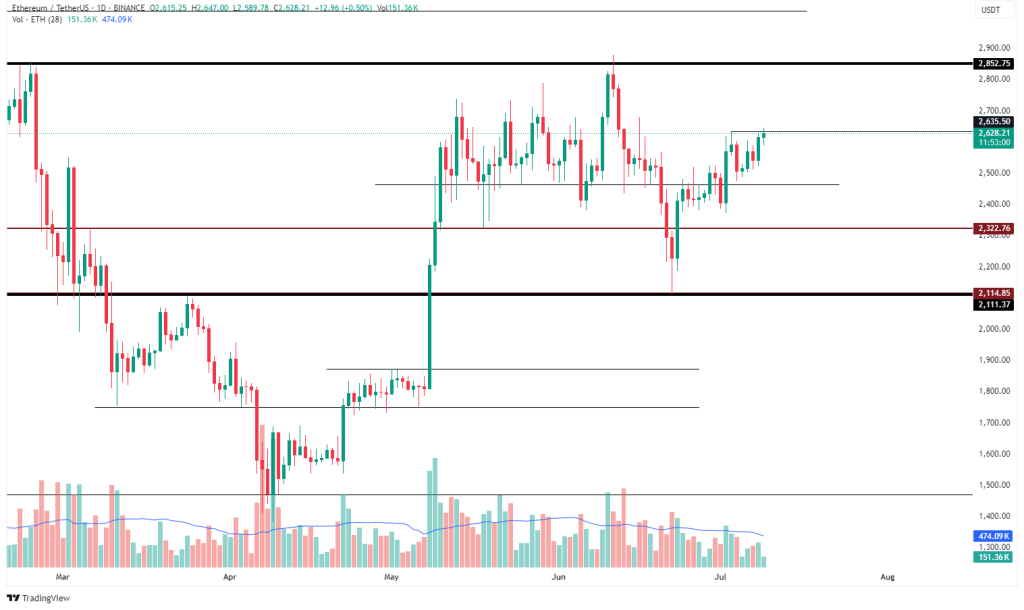
Ethereum remains in a sideways range, locked between the support at $2,485 and the resistance at $2,852. After several failed attempts to break above the midpoint resistance at $2,635, ETH is once again challenging this level. The current breakout attempt is accompanied by moderate volume, but not yet with conviction. A successful daily close above $2,635 would be an important technical development, opening the way for a retest of the $2,850–$2,900 resistance zone. Until that happens, the risk of rejection and a pullback remains, especially if the price drops back below $2,485. Overall, Ethereum is coiling within a range, and the next directional move will likely be driven by how price reacts to these key boundaries.
- Trend: Sideways range between $2,485 support and $2,852 resistance
- Structure: Price is challenging local resistance around $2,635, where previous rallies were capped
- Volume: Moderate, with no strong bullish volume breakout yet
- Outlook: A daily close above $2,635 opens the path to $2,850. Downside risk increases below $2,485
- Techniques Used: Range-bound trading, horizontal level tracking, volume observation
Gold Spot / USD (XAUUSD) Market Overview
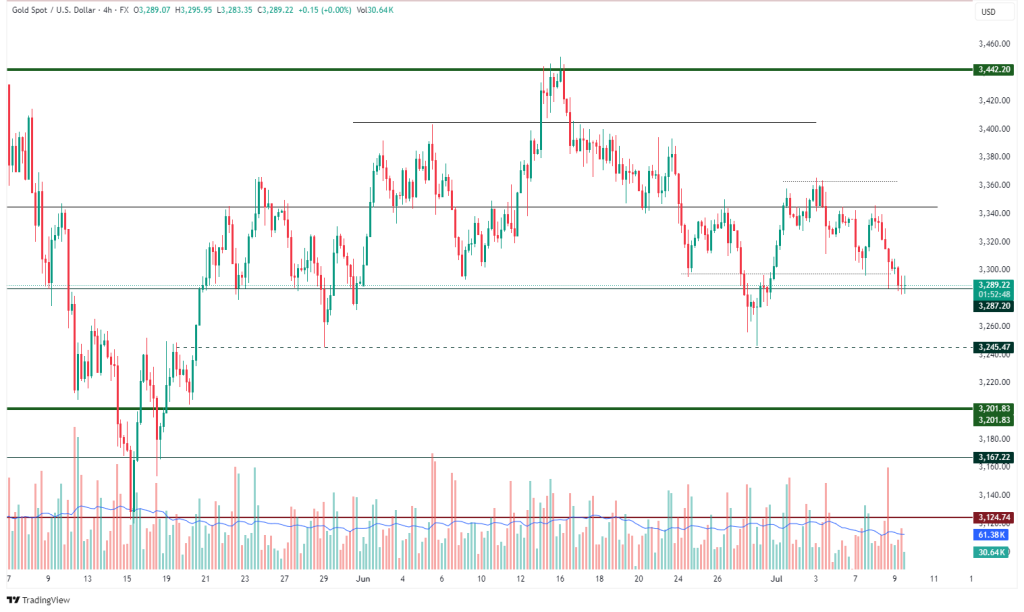
Gold continues to trade within a broad horizontal channel, showing signs of consolidation between the $3,245 support and the $3,360 resistance. The price is currently resting just above the minor support at $3,287, but the inability to maintain gains above $3,300 in recent sessions indicates weakening bullish momentum. If the price fails to hold above $3,287, the next significant support lies at $3,245. Below that, $3,202 and $3,167 are possible downside targets. On the upside, a breakout above $3,360 would shift momentum in favor of the bulls, with a potential run toward the $3,442 resistance. For now, gold remains range-bound, and traders may look for confirmation before positioning for the next major move.
- Trend: Consolidation phase within wide horizontal support and resistance
- Structure: Price is hovering near $3,287, a minor support inside the larger channel
- Key Levels: Resistance at $3,360, Support at $3,245
- Outlook: Break below $3,245 may trigger further downside toward $3,202 or even $3,167. Recovery scenario needs confirmation above $3,360
- Techniques Used: Range and channel analysis, multi-timeframe support/resistance


Leave A Comment