

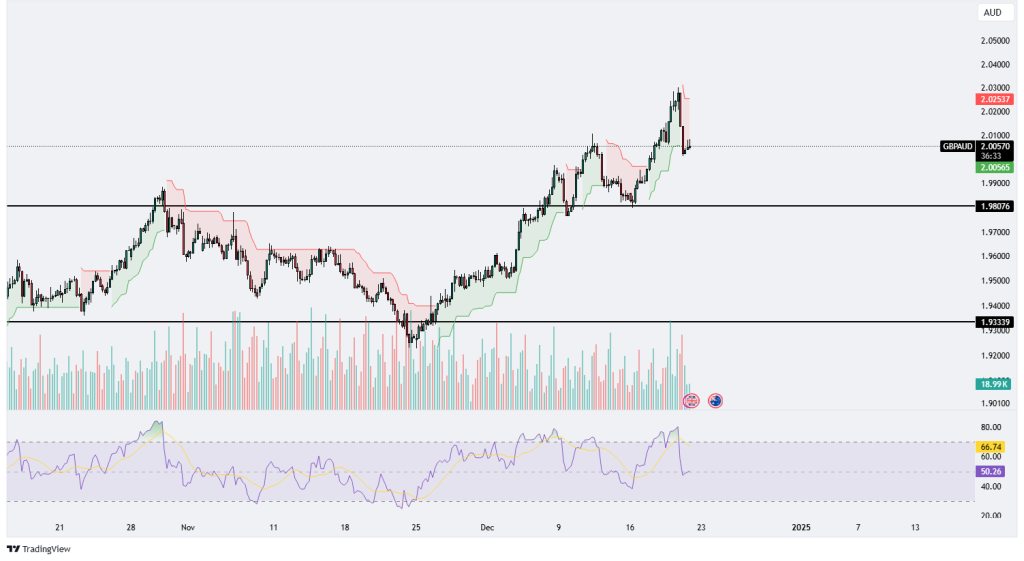
GBPAUD
The GBPAUD chart indicates a recent rejection near the 2.03000 level, suggesting strong resistance in that area, as evidenced by the sharp pullback. The price has retraced to around 2.00565, which aligns closely with a minor support level near the top of the Ichimoku green cloud. This level is crucial for determining whether the current pullback will transition into a deeper correction or if the pair will resume its upward trend. Below this, a more significant support zone is identified at 1.98076, which coincides with previous consolidation and breakout levels.
The Ichimoku cloud highlights a generally bullish trend as the price remains above the green cloud, suggesting buyers are still in control on a broader timeframe. However, the steep decline from the recent highs indicates profit-taking or a potential short-term shift in momentum. The Relative Strength Index (RSI) at 66.74 reflects that the pair was approaching overbought conditions before the pullback. While the RSI is still above neutral territory, it suggests waning bullish momentum, which could lead to consolidation or further retracement.
Volume analysis reveals heightened activity during the upward push toward 2.03000, followed by increased volume on the recent pullback, hinting at a possible tug-of-war between buyers and sellers. A breakdown below 2.00000 could lead to a test of 1.98076, while a bounce from the current levels could push the price back toward the resistance near 2.03000. If the resistance is broken decisively, it would signal the potential for further upside, targeting higher psychological levels such as 2.05000.
In conclusion, GBPAUD is in a critical phase where the current pullback must be closely monitored. The bullish structure remains intact as long as the price holds above 1.98076, but a failure to sustain above this level could open the door for a deeper correction. Conversely, a bounce above 2.00000 with strong volume could reinforce bullish sentiment, targeting the recent highs and beyond.
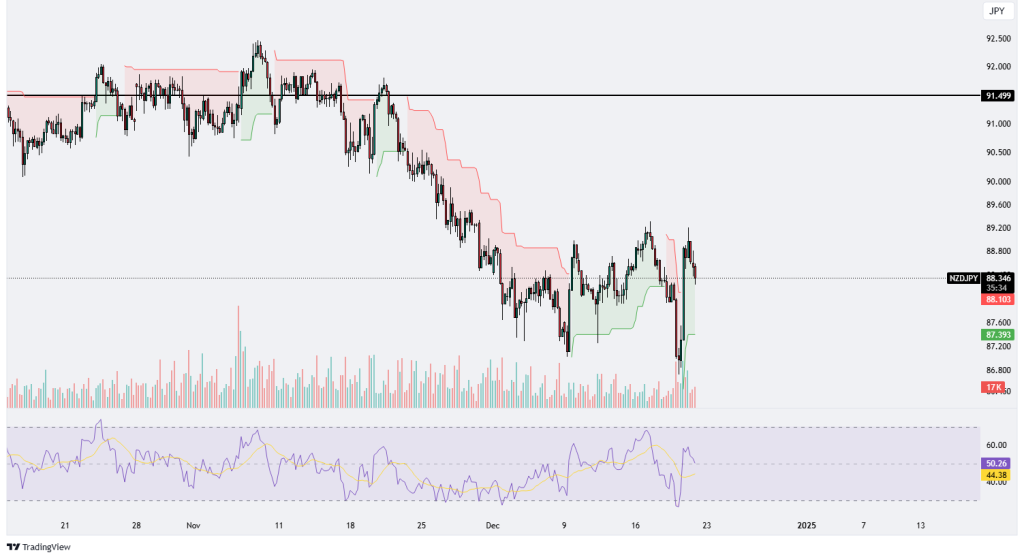
NZDJPY
The NZDJPY chart reflects a volatile price action within a broader downtrend. The pair has recently experienced a sharp decline, followed by an aggressive rebound, suggesting a tug-of-war between buyers and sellers around the 88.00 level. Despite the rebound, the price is trading below the Ichimoku red cloud, indicating that the overall trend remains bearish. The Ichimoku system underscores resistance levels in the 88.50–89.00 range, which the price is struggling to breach.
Significant resistance is evident at 91.50, a level where the price faced multiple rejections in the past, serving as a psychological barrier. Conversely, immediate support lies near 87.40, where the price found some footing after its recent drop. A break below this support could open the door for further downside toward the next significant level around 86.80.
The Relative Strength Index (RSI) at 50.26 suggests neutral momentum, but the broader context of the RSI descending from overbought levels supports a bearish bias. The rebound is losing steam, reflected in declining volume, signaling that the buying pressure might be weakening as the price approaches resistance zones.
In conclusion, NZDJPY remains in a vulnerable position within a bearish trend. The key levels to watch are 87.40 for support and 89.00–91.50 for resistance. A decisive break above the Ichimoku cloud could shift the sentiment toward bullish, while a failure to hold above 87.40 would likely reinforce the bearish narrative, targeting further declines. Traders should monitor volume and RSI movements for confirmation of either scenario.
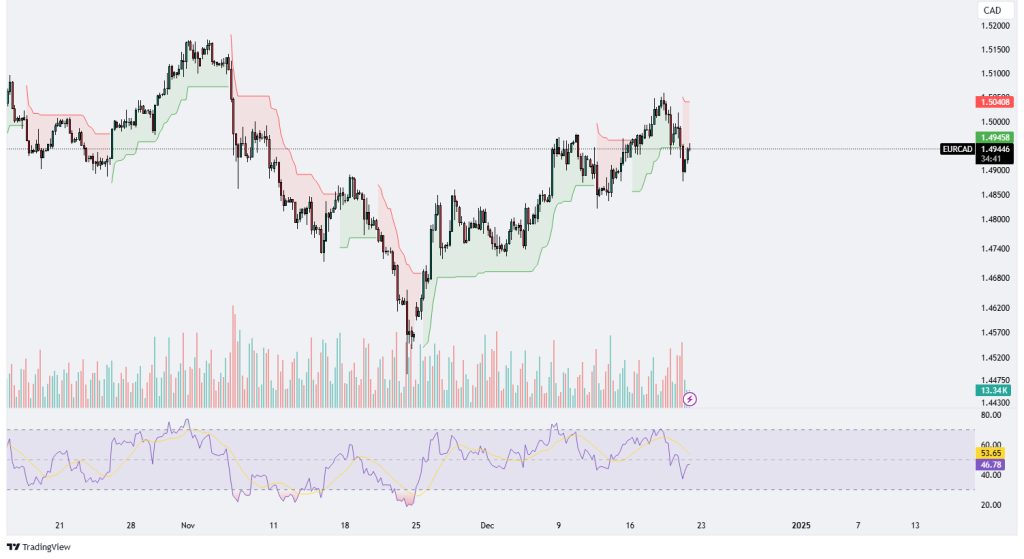
EURCAD
The EURCAD chart indicates a recent rejection near the 1.5040 level, highlighting a strong resistance area around the upper Ichimoku cloud boundary. The pair appears to be pulling back after testing this zone, showing bearish momentum on the shorter time frame. The Ichimoku cloud suggests a neutral-to-bullish structure as the price remains above the green zone, which provides potential support around 1.4900. A breakdown below this level, however, could trigger further downside pressure.
Volume analysis indicates a spike during the recent pullback, which could imply strong seller interest near the resistance zone. Meanwhile, the RSI is currently at 53.65, pointing to a neutral stance with a slight downward bias. This suggests that the momentum is not decisively bearish yet but could turn so if the RSI moves below 50.00.
Overall, EURCAD is oscillating between critical levels, with 1.5040 acting as resistance and 1.4900 as a pivotal support. A sustained move above the resistance would indicate bullish continuation toward higher targets, such as 1.5100 or beyond. Conversely, a break below 1.4900 could open the door for a deeper retracement, targeting 1.4800 or even 1.4700. Traders should watch for confirmation from volume and RSI trends to gauge the strength of the next directional move.
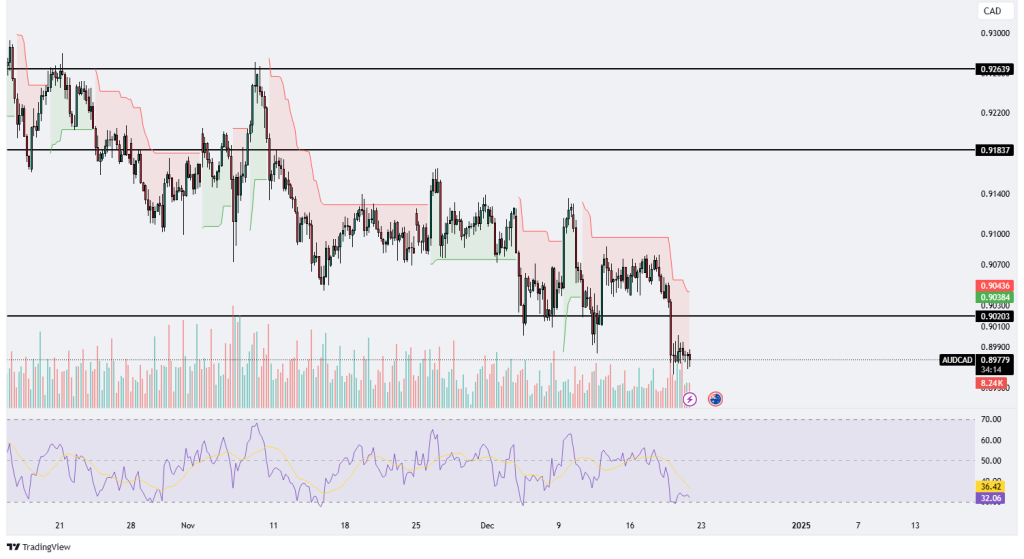
AUDCAD
The AUDCAD chart is showcasing a strong bearish momentum as the pair continues to trade below key support levels, which have now turned into resistance. The price has recently broken below the critical 0.9020 level and is now testing the lower support zone near 0.8980. This zone has previously acted as a pivotal level for price action, and a decisive break below it could signal further downside, potentially targeting levels around 0.8900.
The Ichimoku cloud structure remains bearish, with the price trading well below the red cloud, indicating ongoing selling pressure. The RSI currently stands at 32.14, which is deeply oversold, suggesting that the bearish move might be overextended in the short term. However, oversold conditions can persist in strong trends, and this does not necessarily guarantee an immediate reversal.
Volume analysis indicates increased activity during the recent downward move, which adds confirmation to the bearish sentiment. If the price fails to reclaim the 0.9020 level in the near term, the downward trajectory is likely to continue. Traders should monitor for potential bullish divergence in the RSI or other reversal signals if the price approaches 0.8900, as this could offer a short-term rebound opportunity. Conversely, sustained selling pressure below the current levels would reinforce the bearish trend, keeping sellers in control.


Leave A Comment