


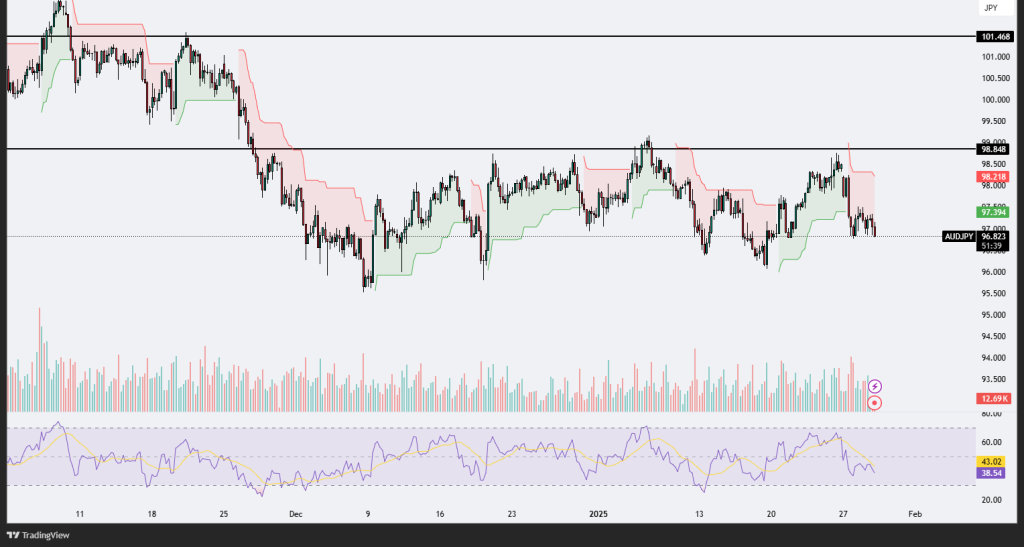
AUDJPY
The AUD/JPY chart shows a market in a sideways consolidation phase, with price action fluctuating between two key levels of support and resistance. The resistance at 98.848 has proven to be a significant barrier to upward momentum, while the support level at 97.394 is providing a cushion against further declines. The supertrend indicator is currently bearish, signaling downward pressure, as price action remains below the trendline. The RSI indicator is hovering near the oversold territory, with a current reading of 38.50, indicating that bearish momentum is dominant but not yet extreme enough for a reversal. Trading volume appears subdued, suggesting a lack of strong market participation or conviction in either direction. If the price breaks below the 97.394 support, it could pave the way for further declines toward 96.820 or lower. Conversely, a breakout above 98.848 would signal renewed bullish strength, with potential to test the psychological level of 101.468. Traders should watch for a definitive breakout from the current range, coupled with an uptick in volume, to confirm the next directional move.
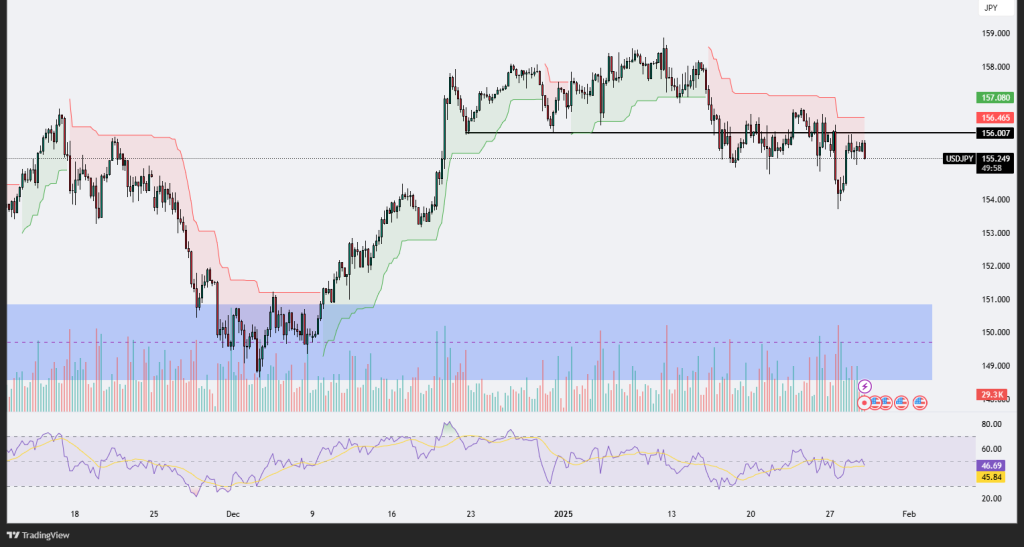
USDJPY
The USD/JPY chart highlights a consolidation phase near the key level of 156.00, which has acted as a pivot zone, creating a battleground between bulls and bears. The price is currently trading slightly below this level at 155.22, with resistance at 156.46 and support at 154.00. The Supertrend indicator reflects a bearish sentiment as the price remains below the trendline, suggesting selling pressure is still dominant. Additionally, the Relative Strength Index (RSI) is hovering near the neutral zone, with a reading of 46.49, indicating a lack of decisive momentum in either direction. The recent rejection from 157.08, a prominent resistance level, emphasizes the challenge for bulls to regain control. Meanwhile, trading volume remains moderate, indicating subdued market participation, which aligns with the current range-bound behavior. If the price breaks above 156.46, it could trigger a bullish rally toward the next resistance level of 157.08. Conversely, a break below the 154.00 support would confirm bearish dominance, potentially leading to a retest of the December lows in the blue support zone. Traders should watch for volume spikes and RSI divergence to anticipate any breakout from this consolidation.
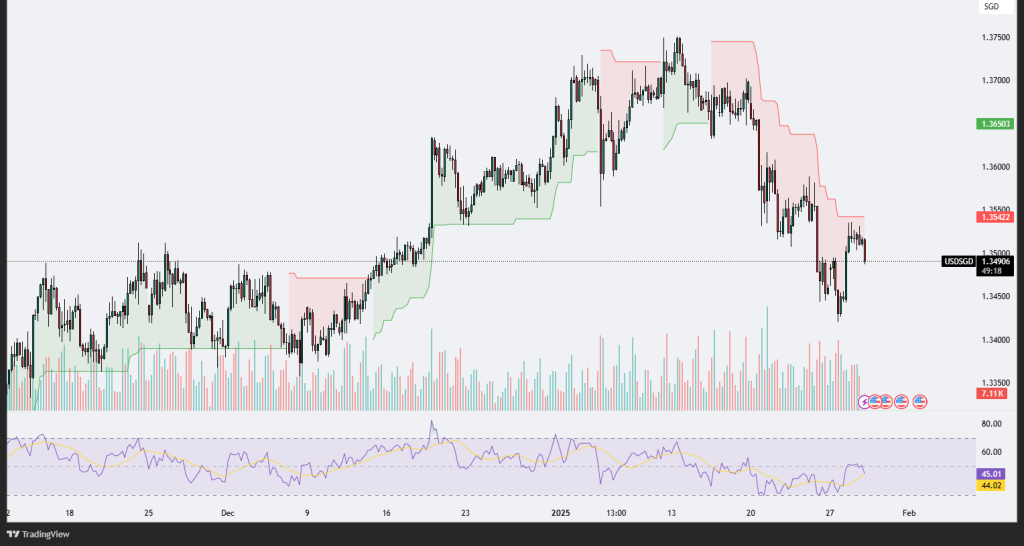
USDSGD
The USD/SGD chart shows a bearish momentum developing after a strong upward trend in the prior weeks. Currently trading at 1.3490, the price is encountering resistance at 1.3542, as indicated by the red Supertrend line. The price has failed to sustain above this resistance level, signaling potential weakness. The Relative Strength Index (RSI) is currently at 44.89, pointing towards a bearish bias as it is below the neutral 50 level, yet not in oversold territory, leaving room for further downside movement. The recent break below the key psychological level of 1.3500 further reinforces the bearish sentiment. Volume appears to have decreased during the latest downtrend, suggesting a lack of strong buyer participation. However, the price has not yet tested the next significant support zone near 1.3450, which could act as a cushion if selling pressure continues. If USD/SGD manages to break above 1.3542, it could target the previous high near 1.3650, though this would require a significant reversal in sentiment and a rise in buying volume. For now, the bearish trend remains dominant, with traders likely watching for a break below 1.3450 for confirmation of further downside.
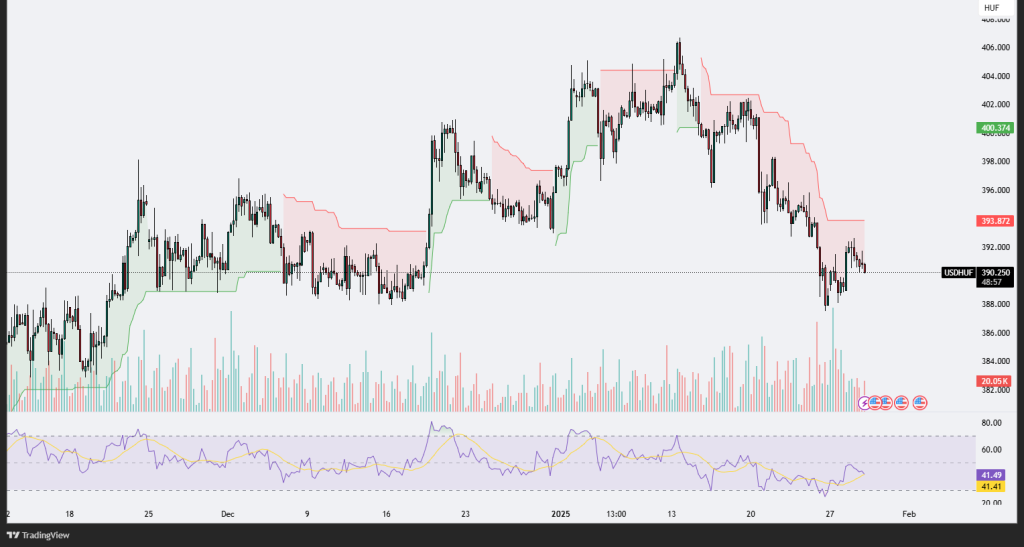
USDHUF
The USD/HUF chart reveals a bearish sentiment, with the price currently trading around 390.26, after failing to maintain levels near 400 in recent sessions. The Supertrend indicator has shifted bearish, with the resistance level clearly marked at 393.87. This suggests that sellers are gaining control in the short term, putting downward pressure on the pair. Volume appears relatively subdued compared to the earlier phases of the decline, indicating a possible lack of strong momentum from buyers or sellers. However, the RSI is at 41.54, which is below the neutral 50 but not yet in oversold territory, suggesting that there is still room for further downside before buyers may step in.
The price action indicates a lower high and lower low structure, consistent with a bearish trend. Any attempt to recover may face resistance near 393.87, and only a sustained move above this level would hint at a potential reversal or consolidation phase. On the downside, the next key support level lies near 386, which could act as a critical test for the strength of the bearish momentum. If breached, it could lead to further declines. Traders may want to monitor the RSI for signs of divergence or confirmation of momentum before taking positions, as well as keep an eye on volume for signs of stronger moves in either direction.


Leave A Comment