

Global investors are closely watching financial market technical analysis as key assets hit critical resistance levels. The Dow Jones tests the upper channel boundary, Gold consolidates below crucial resistance, crypto market capitalization hovers near $3.77T, and GBP/USD battles a long-term ceiling. These movements highlight shifting momentum across equities, commodities, currencies, and digital assets.
Dow Jones Resistance Test – Financial Market Technical Analysis Insight
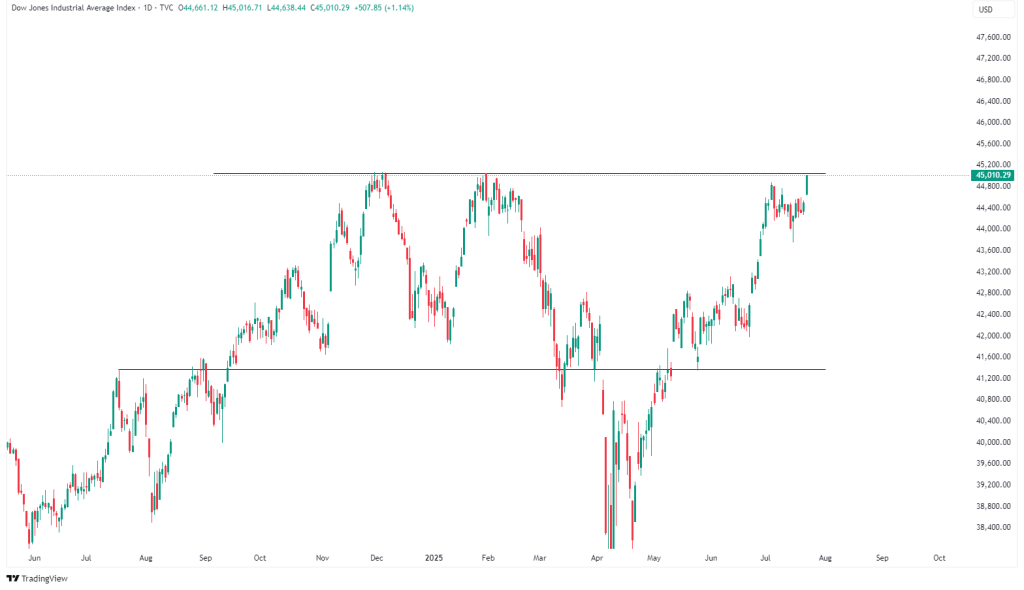
Dow Jones is currently testing the upper boundary of a strong ascending channel. Price action shows a clear push toward the 45,200 resistance zone, which coincides with the top of the parallel trend.
In this phase, the most critical observation is the touches at the upper band, suggesting a potential exhaustion unless there’s a breakout. Historically, this level has served as a turning point. A pullback toward the midline of the channel or even the 43,000 support is possible if price fails to break above with volume confirmation.
Gold Near $3,446 – A Key Zone in Financial Market Technical Analysis
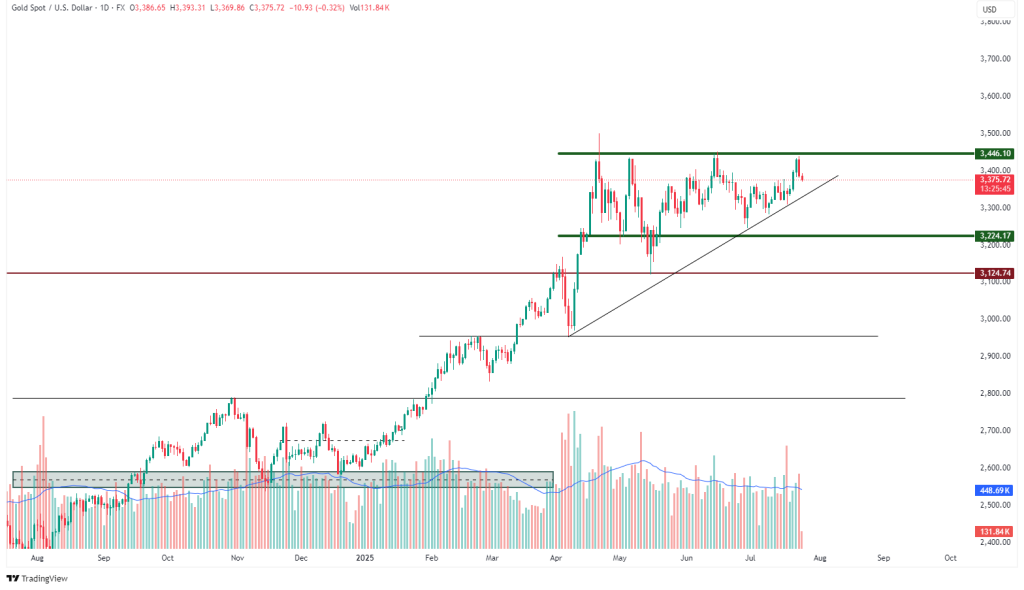
Gold remains within a tight ascending channel, and the price is currently consolidating just below the 3,446 horizontal resistance. This level has been tested multiple times, and the reaction here is crucial for mid-term direction.
The rising trendline is acting as dynamic support. As long as price stays above this line, bullish momentum remains valid. A breakout above 3,446 could trigger acceleration toward new highs, while a rejection may lead to a retest of the 3,300–3,320 support area.
Crypto Market Cap and GBP/USD – Broader Financial Market Technical Analysis Signals
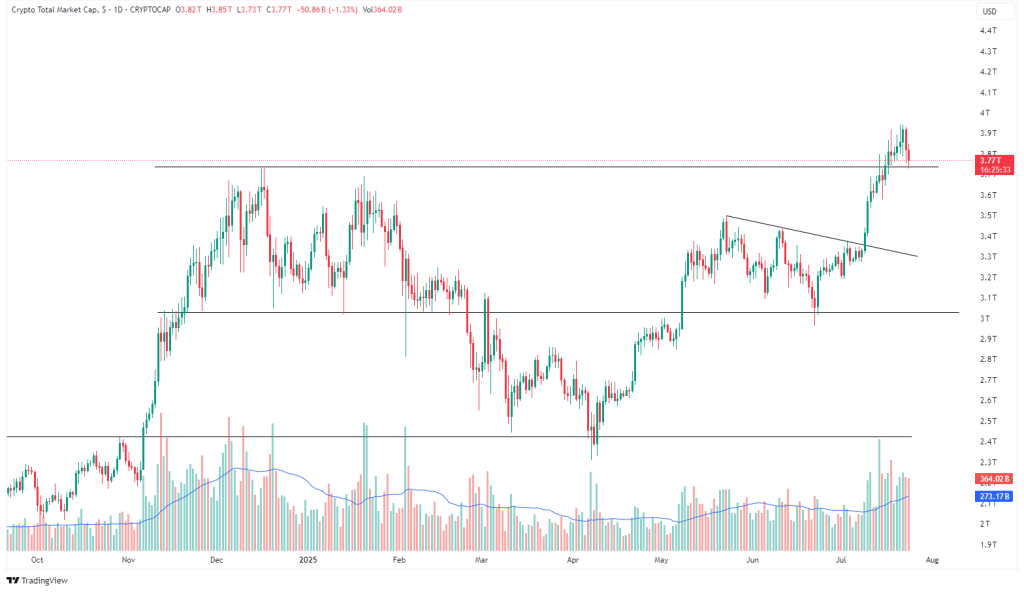
Crypto market cap is hovering under the 3.77T resistance zone, with price clearly respecting this horizontal barrier after a sharp rally. There’s a short-term pullback within an ascending structure, hinting at possible continuation if support holds.
The correction has brought price near a minor trend support, and price compression here could lead to a breakout. Keep an eye on 3.6T as a potential buy-the-dip zone, provided no breakdown occurs below.
GBP/USD Analysis
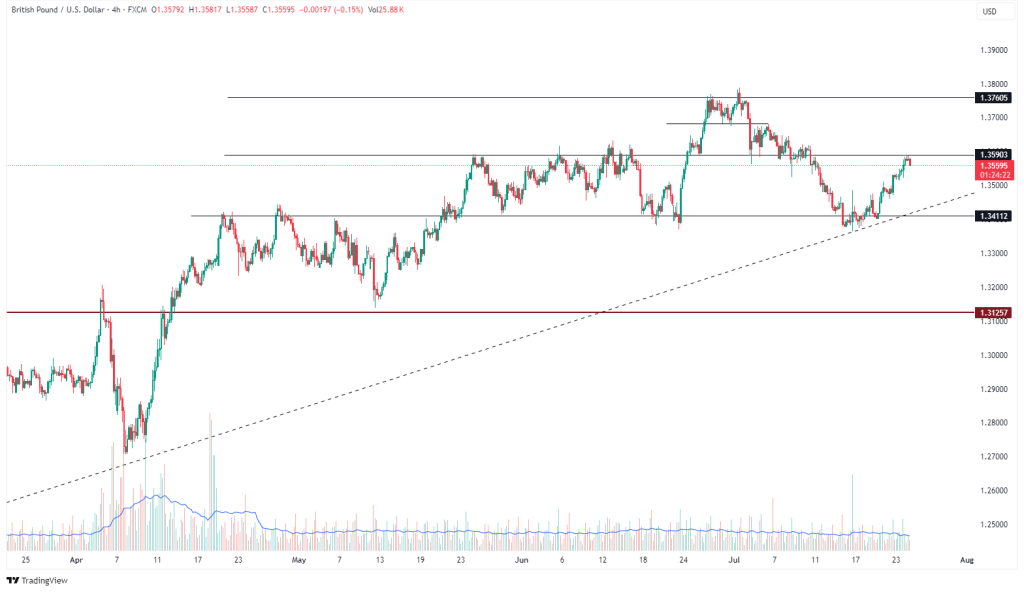
GBP/USD is battling with the 1.3590 resistance, which has acted as a ceiling in the past. The pair previously broke out of a major ascending trendline, and is now retesting that breakout zone.
The retest, combined with the horizontal resistance, makes this a make-or-break area. A clear breakout could launch the pair toward 1.3750–1.38, while rejection may send it back to the 1.3450–1.35 support range.


Leave A Comment