

This multi-asset technical analysis highlights current price structures across metals, forex, equities, and crypto. From Silver’s consolidation to GBPUSD’s retest, NVDA’s pullback, and ETHBTC testing historic lows, traders are watching for decisive moves.
Multi-Asset Technical Analysis: Silver / U.S. Dollar (XAGUSD)
On the 1-hour chart, Silver is caught in a tight range between 35.45 (support) and 36.80 (resistance). Price is oscillating near mid-range (36.04), indicating indecision. A breakout above 36.80 may initiate a move toward the major resistance at 37.30. Conversely, a breakdown below 35.45 opens the door for a retest of 34.80. Currently, volume remains relatively flat, confirming the consolidation phase.
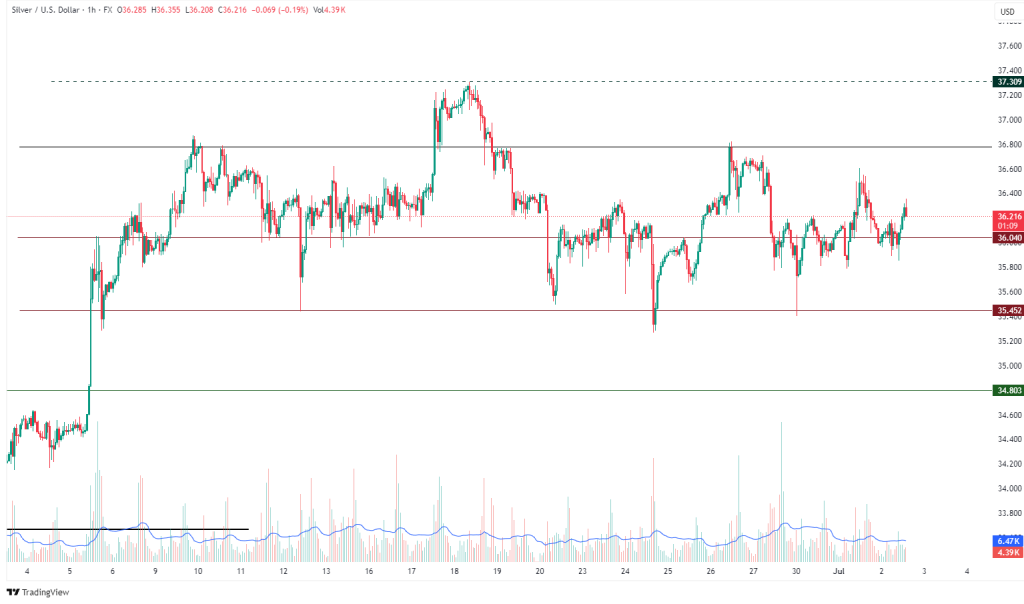
On the 1-hour chart, Silver is caught in a tight range between 35.45 (support) and 36.80 (resistance). Price is oscillating near mid-range (36.04), indicating indecision. A breakout above 36.80 may initiate a move toward the major resistance at 37.30. Conversely, a breakdown below 35.45 opens the door for a retest of 34.80. Currently, volume remains relatively flat, confirming the consolidation phase
British Pound / U.S. Dollar (GBPUSD)
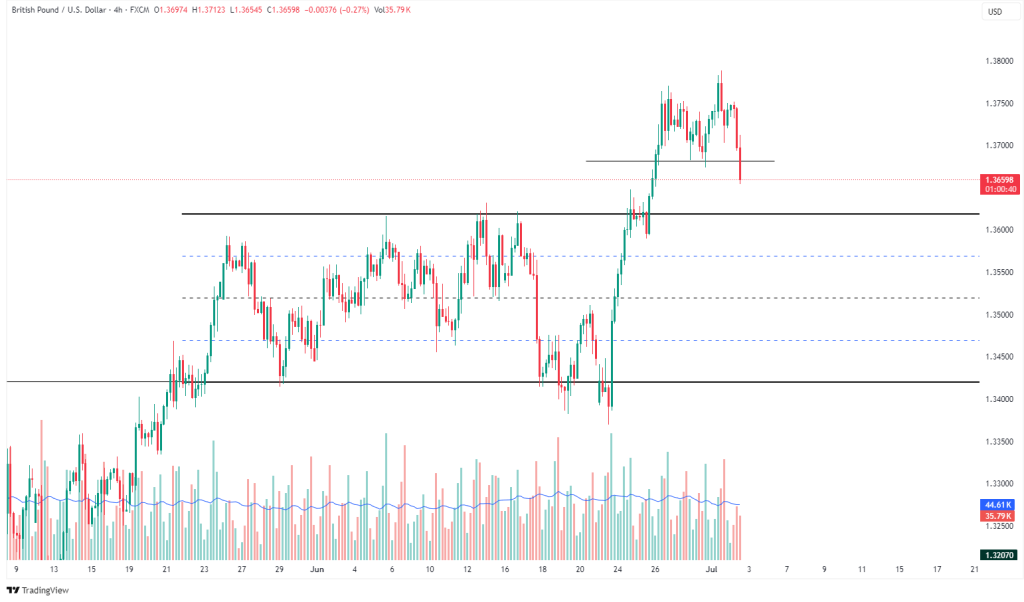
The 4-hour chart of GBPUSD highlights a breakout and recent retest of the 1.37000 level, now turning into resistance after rejection. Price is now testing prior demand around 1.36500. If this fails, potential retracement levels lie around 1.36000 and 1.35000. Continuation to the upside requires a reclaim of 1.37000 followed by bullish momentum above 1.37500.
Multi-Asset Technical Analysis: NVIDIA Corporation (NVDA)
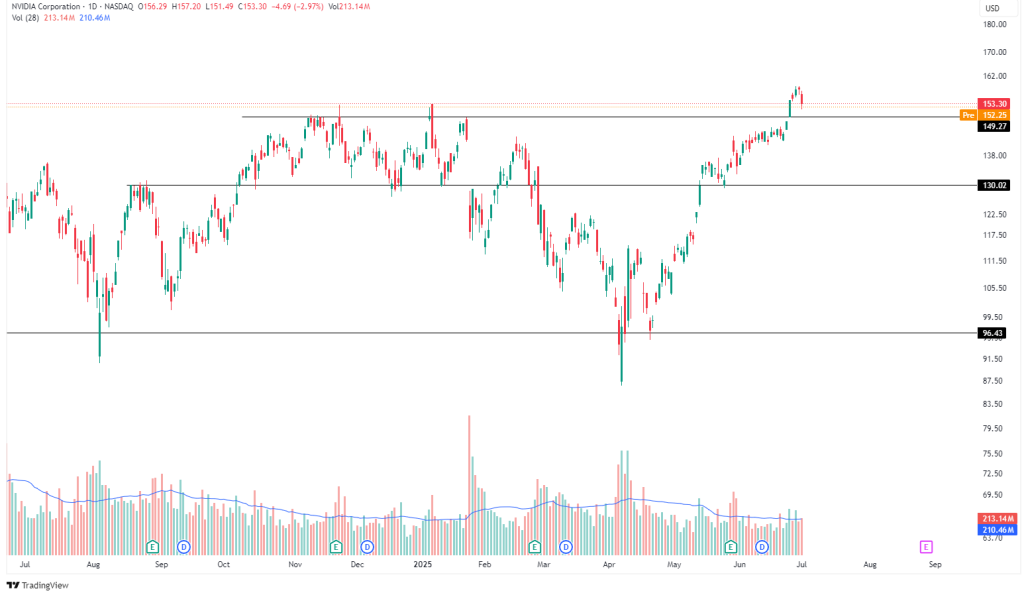
The NVDA daily chart shows a parabolic rally followed by a pullback from the recent peak around 157.20. Price action has returned near the former breakout level of 152.25, which now acts as immediate support. If this holds, it may serve as a launchpad for another leg higher. However, losing this level exposes downside to the next demand area near 130.00. Volume surged during the recent peak and is worth monitoring for clues on trend continuation or reversal.
Ethereum / Bitcoin (ETHBTC)
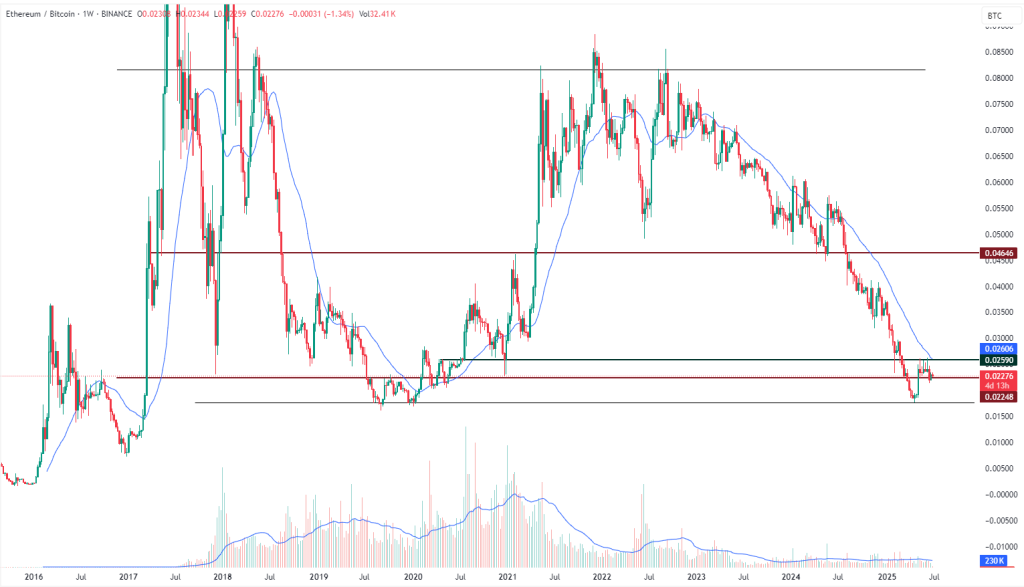
The ETHBTC weekly chart shows a prolonged downtrend, with the price attempting to stabilize around the 0.02250 support zone. This area coincides with historic multi-year support levels and has held during prior significant selloffs. The recent rejection at 0.02660 and 200 Days EMA (blue line) suggests bears still have control. A confirmed breakout above 0.02660 could shift short-term momentum toward 0.03000, while a loss of 0.02248 may trigger further downside to around 0.02000.


Leave A Comment