

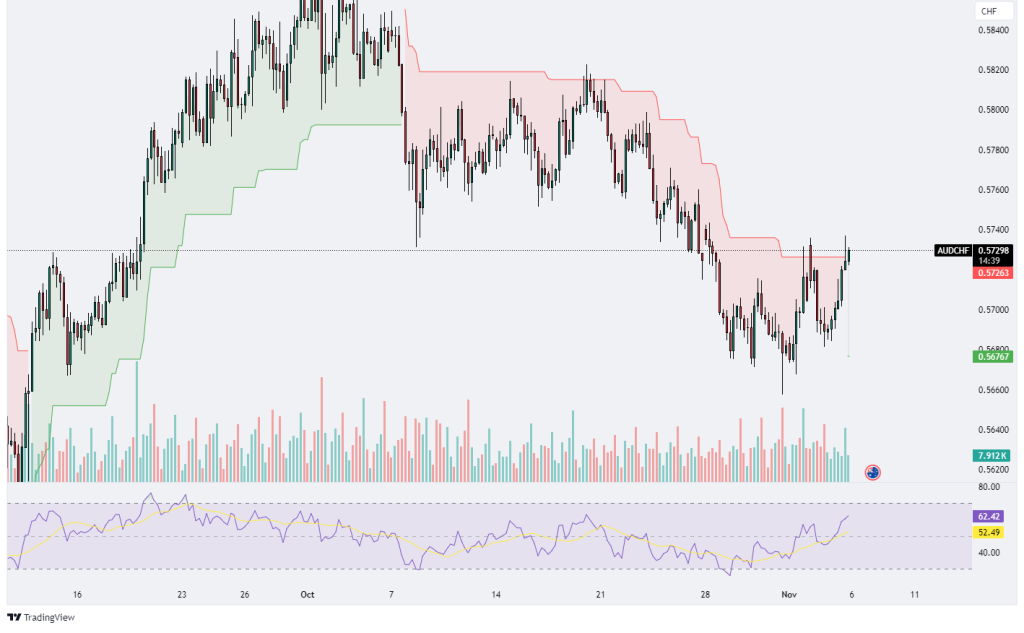
AUDCHF
The AUD/CHF chart displays a recent bullish recovery from its previous downtrend, with the price currently testing a key resistance area around 0.57308. After hitting a low near 0.56767, the pair has shown strong upward momentum, breaking through minor resistance levels and now approaching the Ichimoku cloud’s lower boundary, which has been red and has acted as a resistance zone. If the price manages to break above this cloud, it could signal a further bullish continuation. However, this cloud boundary may act as a strong resistance, particularly given that it aligns with previous levels where sellers have previously dominated. The Relative Strength Index (RSI) is currently at 62.77, indicating increased bullish momentum but nearing the overbought zone, which could lead to a temporary pullback if buying pressure weakens.
The volume profile shows a rise in trading activity as the price ascended, suggesting that the recent upward move has attracted market participation. This volume increase, combined with the RSI nearing overbought conditions, hints that buyers are currently in control but may soon encounter resistance, especially if the momentum wanes near the cloud boundary. A successful breakout above the cloud and sustained trading above 0.57308 could signal a shift in trend, with the next potential target around the previous highs near 0.57800. Conversely, if the price faces rejection at the cloud, it may retrace toward the support around 0.56767, where buyers previously stepped in. In summary, while AUD/CHF is showing bullish strength, the Ichimoku cloud and the nearing overbought RSI suggest caution, with the potential for either a continuation toward higher levels or a pullback if resistance holds firm.
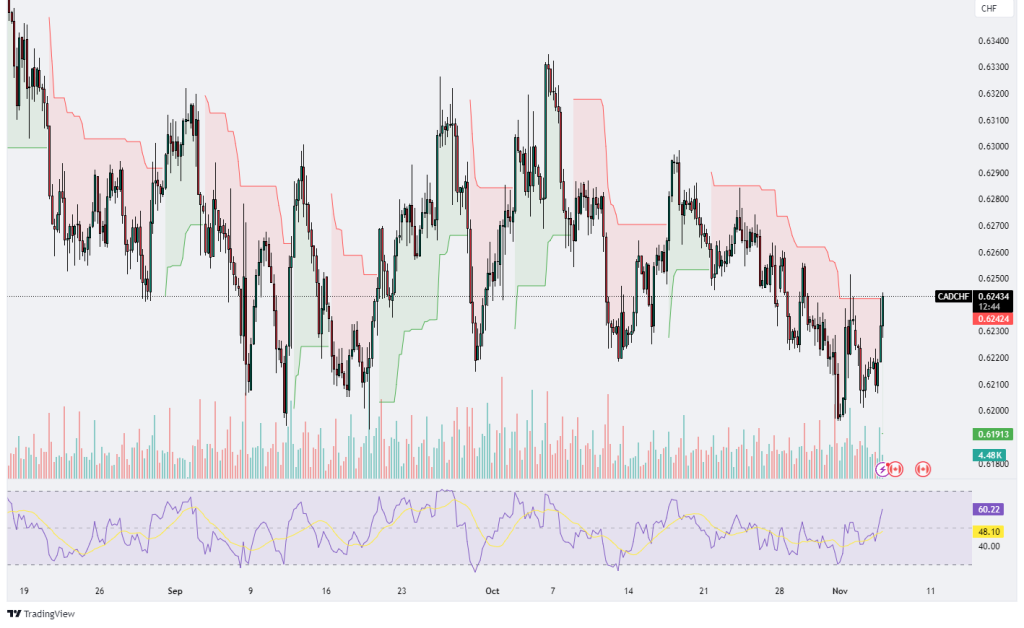
CADCHF
The CAD/CHF chart indicates a fluctuating, range-bound movement within a well-established consolidation zone, with the price currently around 0.62434. Over the past few weeks, the pair has experienced repeated swings, with each attempt to break out of this range meeting strong resistance or support, signifying indecision in the market. The Ichimoku cloud on the chart has switched between red and green multiple times, indicating a lack of clear directional momentum and reinforcing the sideways nature of the price action. Currently, the price is attempting to push above the Ichimoku cloud, suggesting a potential shift in bullish sentiment. However, previous price action reveals that such attempts have often failed, with sellers regaining control and pushing the price back within the range.
The Relative Strength Index (RSI) is at 60.22, suggesting mild bullish momentum but not yet in overbought territory. This RSI level indicates that while there is buying interest, it may not be strong enough to initiate a breakout unless the price can attract more significant demand. The volume has shown a slight increase during this latest rally, reflecting some buying interest, but the overall volume pattern remains subdued, consistent with the range-bound behavior. If the price manages to sustain above the cloud and continue upward, it may target the next resistance level around 0.62600-0.62800, where previous highs were established. On the downside, if the bullish momentum fails to hold, the pair could retrace toward the lower support level around 0.61913, where buyers have previously entered. In summary, CAD/CHF is caught in a consolidation phase, and while there are signs of a possible bullish breakout, the chart structure and moderate RSI suggest caution, with key support and resistance levels likely determining the next significant move.
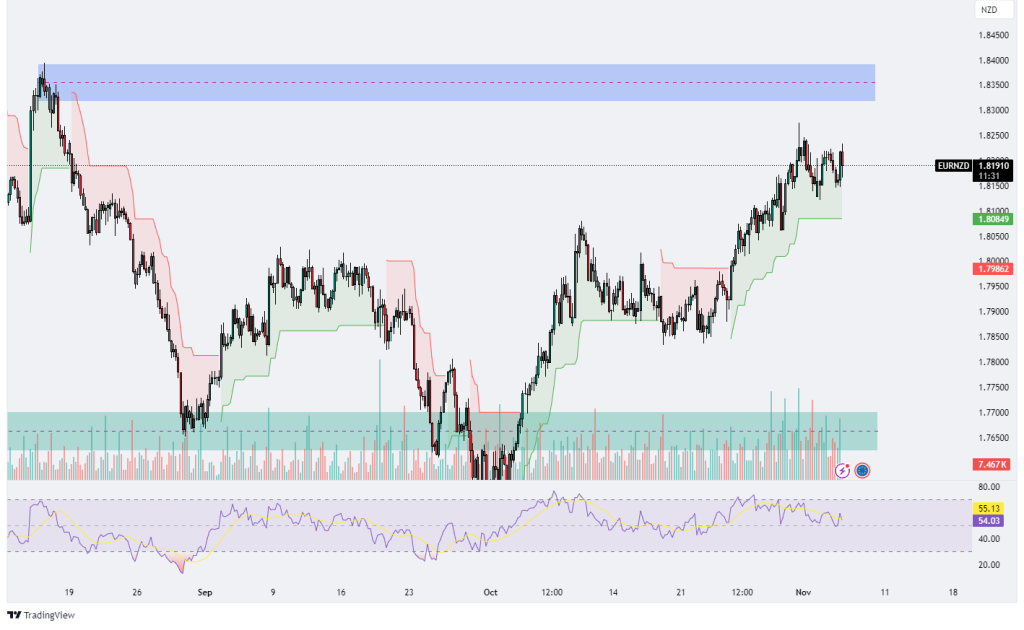
EURNZD
The EURNZD chart shows a steady upward movement following a breakout from a significant support zone around 1.79862, with the current price trading near 1.81908. This level places the pair close to the upper limit of its recent range, approaching a resistance area, indicated by the blue shaded zone, between 1.83000 and 1.84000. After the initial breakout, the price has been maintaining a bullish momentum, with the Ichimoku cloud providing a green and supportive backdrop, which suggests the trend may continue as long as the price remains above the cloud. However, the proximity of the resistance zone implies that buyers might face challenges pushing the price higher, and a reversal could happen if selling pressure increases in this area. The Relative Strength Index (RSI) is currently around 55.12, slightly above the neutral mark, suggesting mild bullish strength but not yet in overbought territory, which allows room for a potential move higher.
Volume data shows a gradual increase in activity during the upward trend, indicating that the breakout has garnered interest from market participants, although no significant volume spikes suggest that the momentum may be steady but cautious. Should the price break above the resistance zone, it would open up potential for further gains toward higher levels, possibly targeting the next psychological levels around 1.85000. Conversely, if the pair fails to clear the resistance, it could see a pullback toward the nearest support level at 1.80849, where buyers may step in to defend the bullish trend. In summary, EURNZD is in a bullish phase with strong support from the Ichimoku cloud, yet it faces resistance that may limit immediate upside potential. The next movement will likely depend on how the price interacts with the resistance zone and whether the bullish momentum can sustain against it.
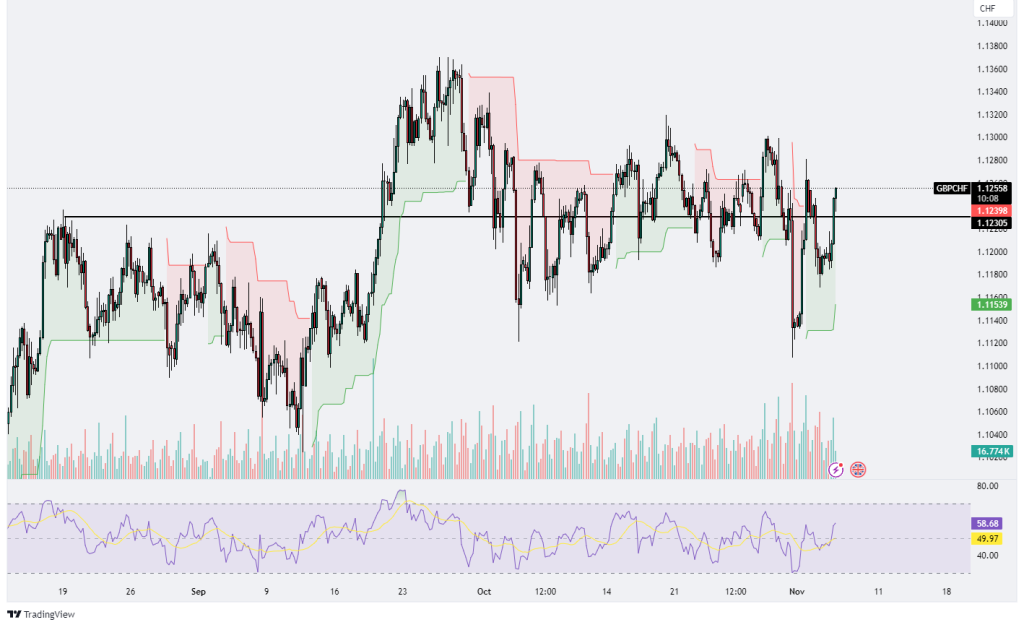
GBPCHF
The GBP/CHF chart shows a period of consolidation within a broad range, with the price currently trading around 1.12558 after testing a resistance level near 1.12398. Over recent weeks, the pair has oscillated between key support around 1.11539 and resistance near 1.12398, highlighting a lack of decisive direction and indicating a range-bound market. The Ichimoku cloud is mixed, alternating between red and green in this consolidation phase, which suggests indecision and lack of strong trending momentum. Presently, the price is positioned just above the Ichimoku cloud, reflecting mild bullish sentiment, although previous attempts to break significantly above this level have been met with resistance, leading to sharp pullbacks.
The Relative Strength Index (RSI) currently stands at 58.68, slightly above the neutral 50 level, indicating moderate bullish momentum. This RSI reading suggests that buyers have gained some control, but the momentum remains cautious and could turn if the price faces further resistance near 1.12558. The volume has been relatively stable, without significant spikes, suggesting that while there is some interest in these price levels, there isn’t a strong push in either direction to break out of the range. If the price continues to climb and successfully breaks above the resistance at 1.12558, it could signal a potential shift towards a more bullish outlook, targeting the next resistance levels near 1.13000 and beyond. However, failure to maintain above 1.12398 could result in a pullback toward the support area around 1.11539, where buyers may look to re-enter the market.


Leave A Comment