

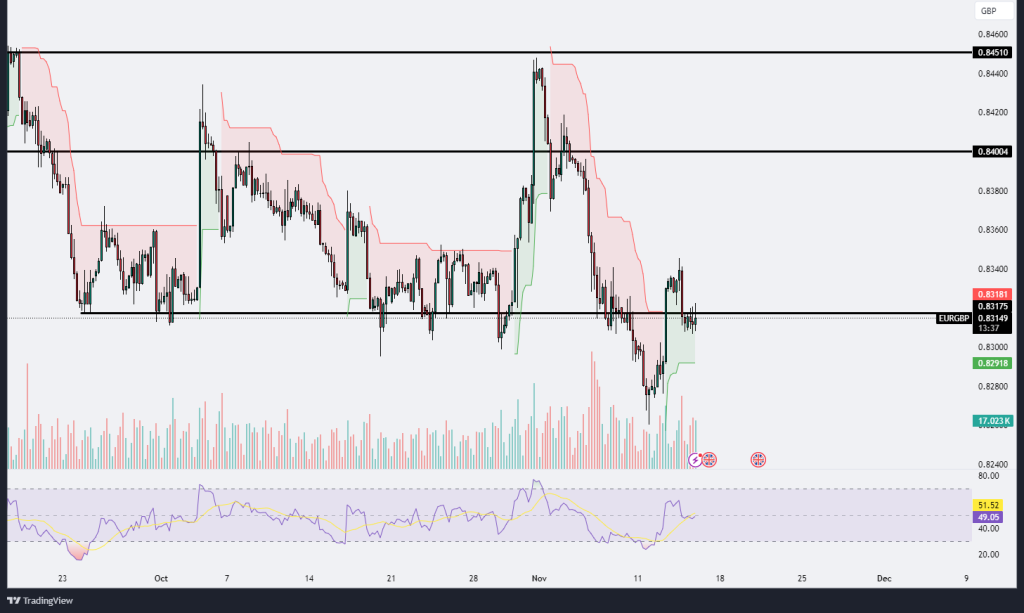
EURGBP
The EUR/GBP chart reflects a market in consolidation with some recent bullish attempts to break out of the lower levels. Currently, the price is trading around 0.83181, a level close to recent resistance near 0.8320. Overhead resistance is notably present around 0.84004, which could pose a barrier for further upward movement. The Ichimoku cloud on the chart shows a red zone above the current price, indicating a bearish sentiment that may keep prices capped below resistance levels in the short term. The RSI indicator is just above 50, indicating a slight bullish momentum, but it lacks the strength needed for a significant breakout. Volume has shown spikes, especially around previous attempts to breach resistance, which indicates active interest from both buyers and sellers at this level. If the pair fails to break above the 0.84004 resistance convincingly, it could face renewed selling pressure, potentially driving it back toward the support level around 0.82918. On the other hand, a decisive break above the red cloud and 0.84004 could open up more upside potential, possibly targeting the next resistance near 0.84510.
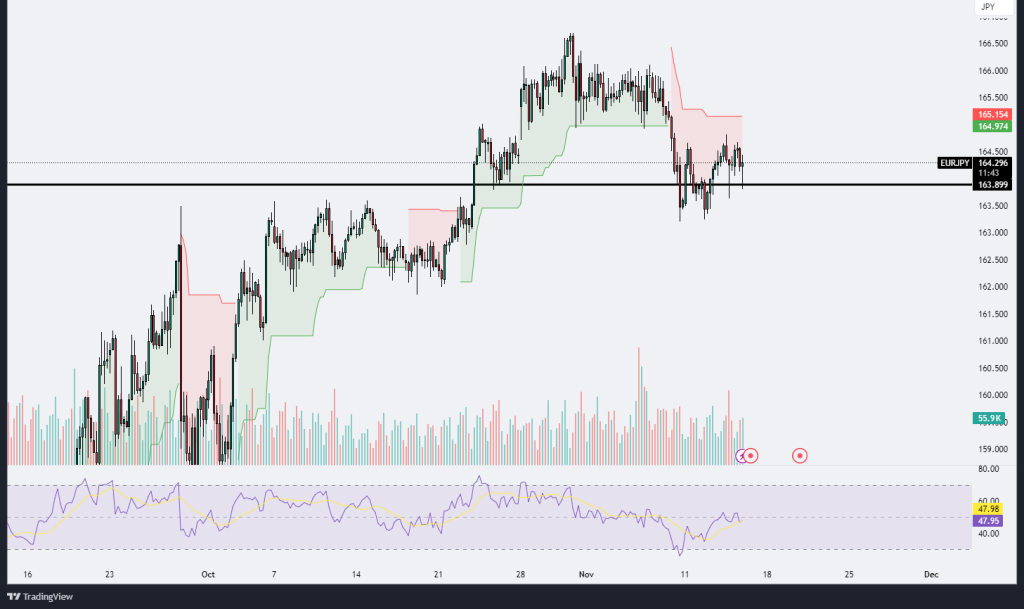
EURJPY
The EUR/JPY chart shows a period of consolidation around the 164.30 level, with recent price action exhibiting some indecision. The price has bounced around this level multiple times, indicating it as a significant point of interest for both buyers and sellers. Currently, the Ichimoku cloud on the chart reflects mixed sentiment, with the green cloud in earlier sessions transitioning to red, suggesting that bullish momentum has weakened. This shift could indicate potential resistance around 165.15, where previous upward movements faced obstacles. Meanwhile, the RSI is hovering close to the 50 mark, reflecting neutral momentum with a slight bearish tilt, suggesting that neither bulls nor bears are currently in strong control. The recent price rejection from the cloud’s lower boundary and the lack of volume spikes imply that the market is in a wait-and-see mode, awaiting further catalysts to determine direction. If the price breaks below the 163.90 support, it may open the door for further downside toward the 163.00 area, while a move above 165.15 would indicate renewed buying interest, possibly leading to a retest of recent highs.
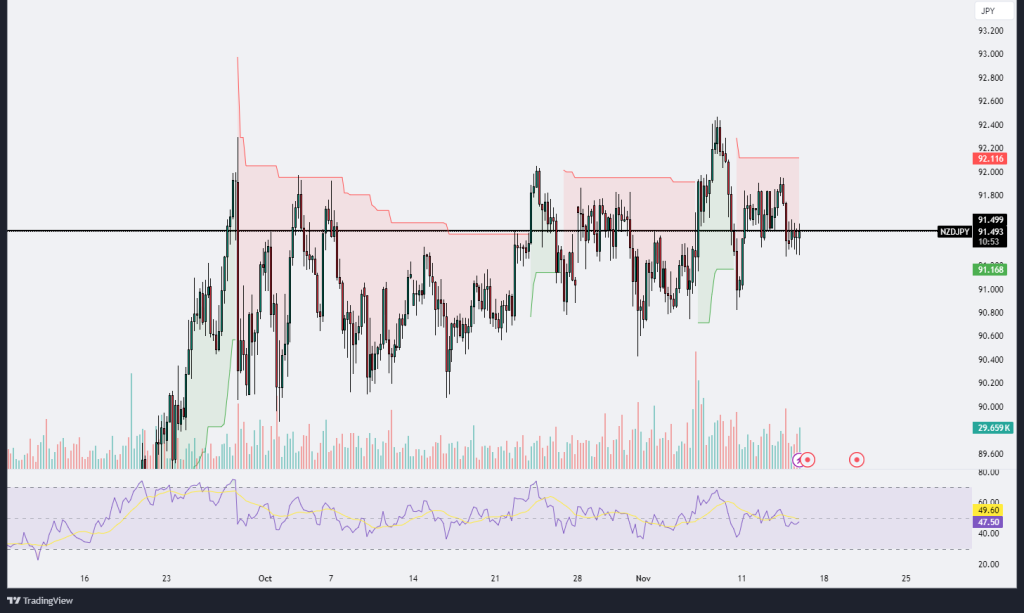
NZDJPY
The NZD/JPY chart displays a period of consolidation around the 91.50 level, which has acted as a key pivot point in recent sessions. The price has been fluctuating near this level without a clear directional breakout, reflecting a balance between buyers and sellers. The Ichimoku cloud indicates bearish pressure, as the price is currently within or just below the cloud, signaling that any upward momentum is currently limited. However, recent attempts to breach the resistance around 92.20 have failed, resulting in a pullback, which suggests that buyers lack the strength to drive a sustained rally. On the downside, support around 91.16 is evident, where buyers have consistently stepped in to prevent further declines. The RSI is near the 50 level, indicating neutral momentum with neither bulls nor bears holding a clear advantage. Volume has remained relatively steady but lacks significant spikes, suggesting that traders may be waiting for a clearer signal before committing to new positions. If the price breaks above 92.20, it could open the door for a more sustained rally, while a move below 91.16 might lead to further downside, potentially testing the psychological 90.00 level.
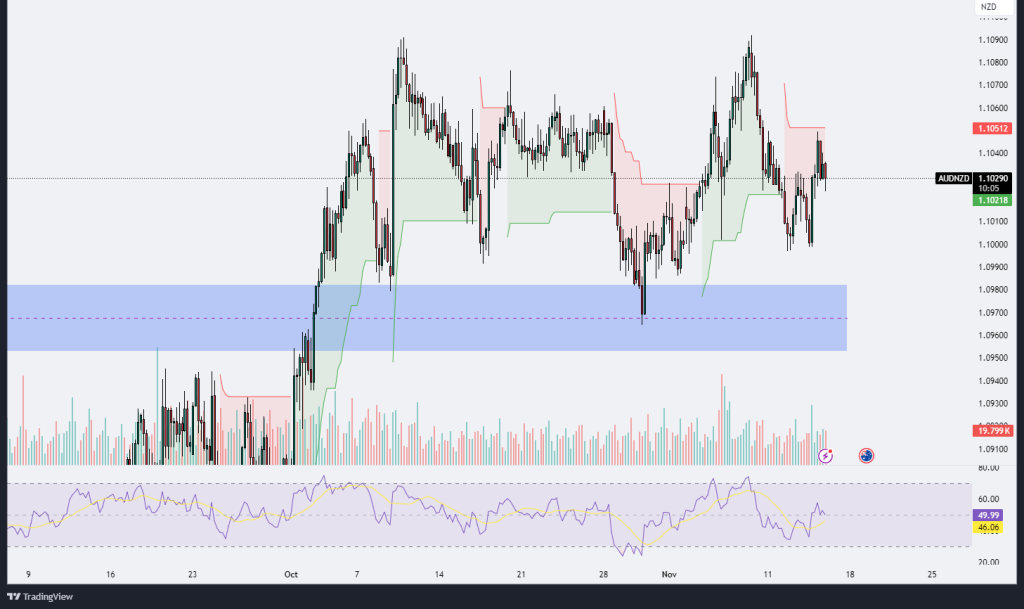
AUDNZD
The AUD/NZD chart shows the price currently oscillating near 1.10289, displaying some consolidation after recent fluctuations. The Ichimoku cloud indicates a period of mixed sentiment, as the price moves within the cloud, suggesting that neither bulls nor bears have gained significant control. The support level near the 1.0970 area, highlighted by the blue zone, has held firm in recent attempts by sellers to push the price lower, signaling strong buying interest at this level. The resistance level at 1.10512 has seen some selling pressure, as evidenced by the price pullbacks upon reaching this level. The RSI hovers around the 50 mark, reflecting a neutral momentum and indicating that the market lacks a clear trend direction. Volume appears relatively stable, with occasional spikes that suggest intermittent buying and selling interest, but no definitive directional breakout. Should the price manage to break above 1.10512, it could trigger further upside momentum, potentially driving the price towards the next resistance level. Conversely, a break below the support zone around 1.0970 might lead to a deeper decline, potentially testing lower support levels. For now, the AUD/NZD appears to be in a wait-and-see mode, with traders likely watching for a stronger momentum signal before committing to a particular direction.


Leave A Comment