


This technical market outlook covers major assets in focus today. DXY attempts a recovery, gold forms a potential double top, Ethereum consolidates above key supports, and NASDAQ 100 sustains bullish momentum after its breakout.
Technical Market Outlook: U.S. Dollar Index (DXY)
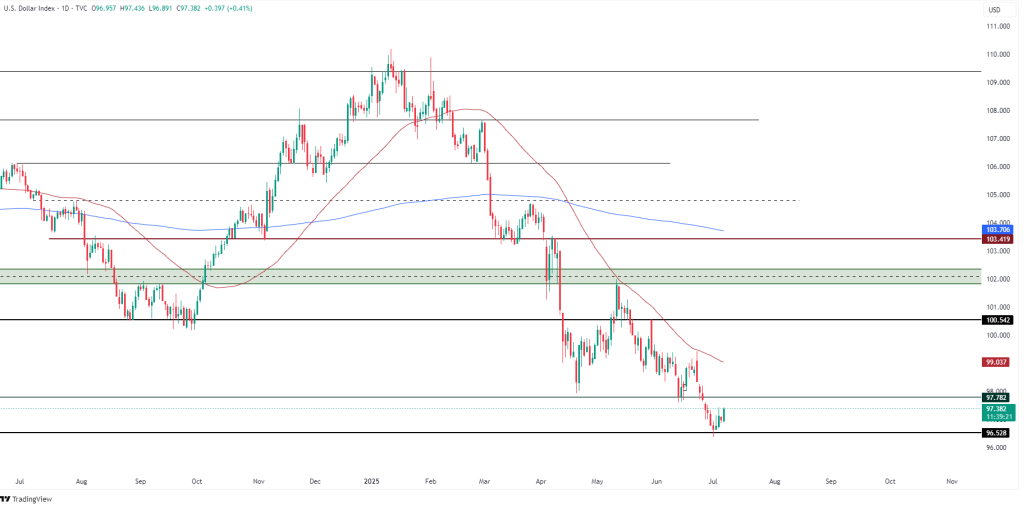
DXY is attempting a recovery from the 96.52 support level, with the current bounce potentially targeting 99.03. Despite this short-term strength, the broader downtrend remains intact, and any upside could face strong resistance around the 100.54–103.70 range. A failure to reclaim 99.03 may renew bearish momentum.
Key Levels:
- Resistance: 99.03 – 100.54 – 103.70
- Support: 96.52
Technical Market Outlook: Gold / USD (XAU/USD)
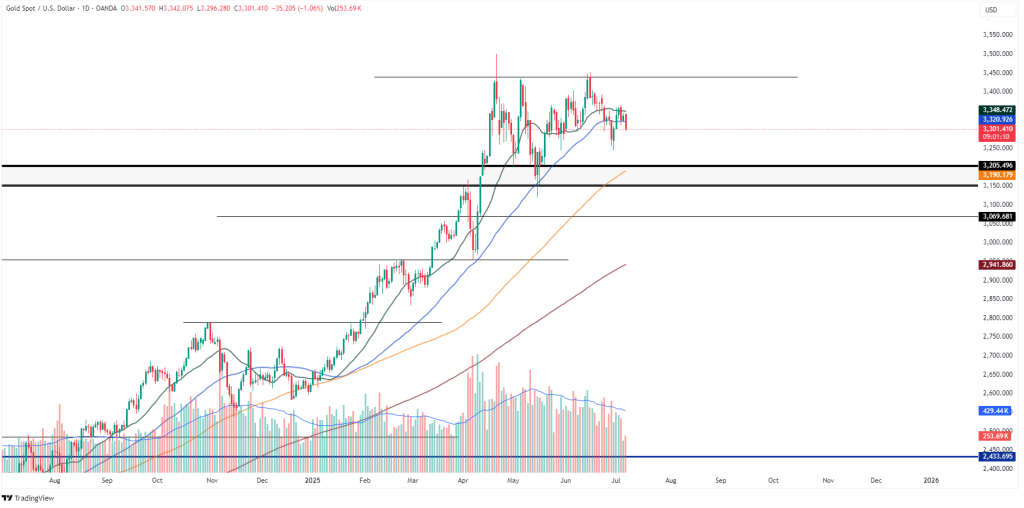
Gold has formed a potential double-top pattern near $3,348, failing to break higher and pulling back toward $3,190–$3,205 support. Sustained closes below this support zone could bring $3,069 into focus. Trend remains bullish overall, supported by 50/100/200 EMA alignment, but short-term caution is warranted.
Key Levels:
- Resistance: $3,348
- Support: $3,205 – $3,069 – $2,941
Ethereum / USDT Analysis
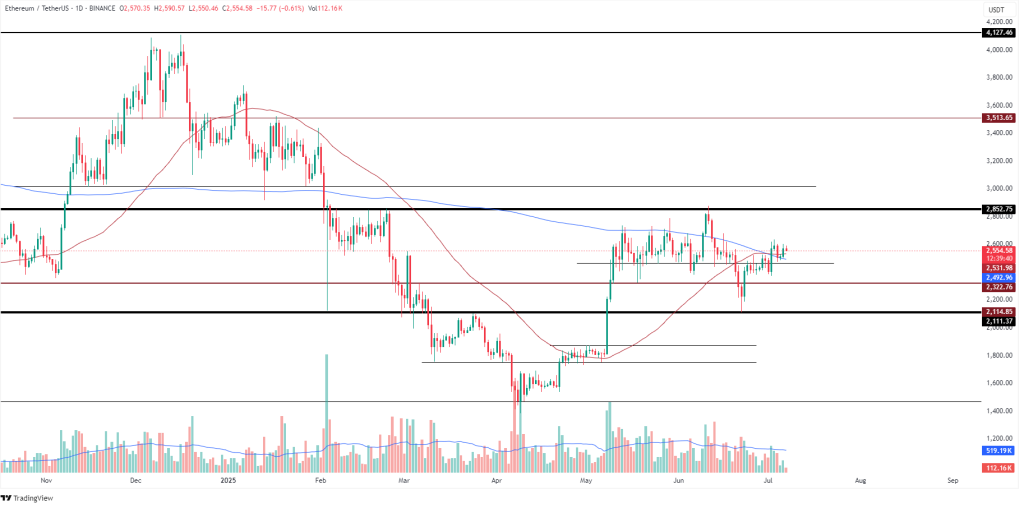
Ethereum is currently hovering around the $2,550–2,600 range, just above the 200-day EMA (blue line), suggesting a neutral-to-slightly-bullish bias. Price is consolidating above the $2,492 and $2,322 support levels, while struggling to sustain momentum towards the $2,852 resistance zone. A daily close above this resistance could signal a bullish breakout, while a breakdown below $2,492 would indicate renewed bearish pressure.
Key Levels:
- Resistance: $2,852 – $3,513
- Support: $2,492 – $2,322 – $2,111
NASDAQ 100 (NAS100) – 4H Chart
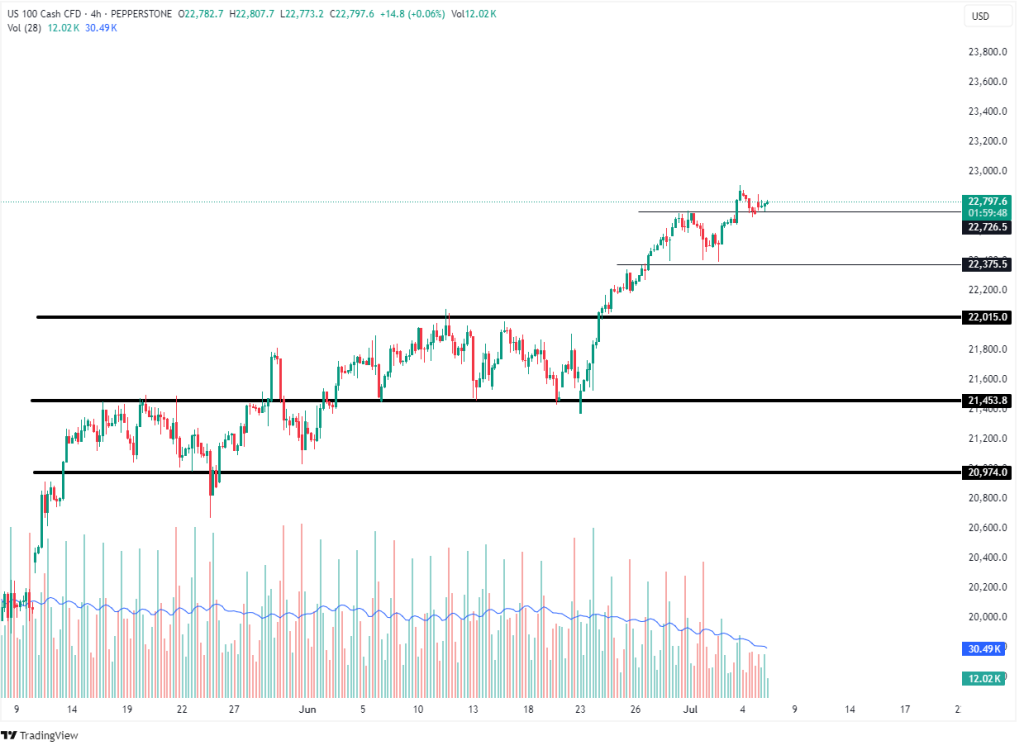
NASDAQ 100 continues its strong upward momentum, currently consolidating just above the 22,726 breakout level after a steep rally. The recent price action suggests a minor pause near the highs, which is typical after a breakout phase. However, decreasing volume during this consolidation could signal some short-term exhaustion, making the current zone crucial for momentum sustainability.
Price remains well above all key support levels, maintaining higher highs and higher lows. As long as the price holds above 22,375, the bullish structure remains intact. A continuation above 22,800 may open the path toward new highs, potentially targeting 23,000+ levels.
On the downside, a break below 22,726 could lead to a short-term correction toward 22,375 or even 22,015 without damaging the overall uptrend.
Key Levels:
- Immediate Resistance: 22,800 – 23,000+
- Immediate Support: 22,726 – 22,375
- Deeper Support: 22,015 – 21,453


Leave A Comment