

Unlocking the Power of Bullish Harami
In the fast-paced world of trading, identifying reliable trading candlestick patterns is key to maximizing profits. One of the most powerful yet often overlooked formations is the bullish harami candlestick pattern. If you’ve ever wondered how to trade bullish harami, this guide will break it down step by step with detailed explanations and real-world examples.
The bullish harami trading strategy revolves around recognizing this pattern at key market levels and using it as a confirmation of trend reversals. But how reliable is the Bullish Harami pattern? And what is the psychology behind the Bullish Harami pattern? Let’s dive in and uncover the details with in-depth analysis.
1. What is a Bullish Harami? The Hidden Reversal Signal
Understanding the Pattern
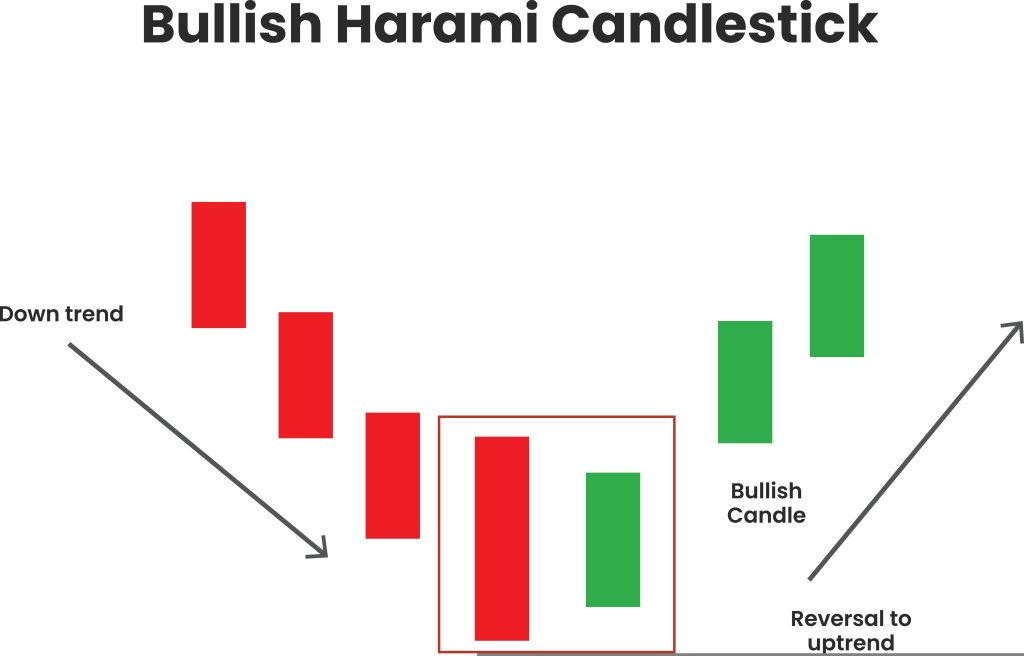
A bullish harami is a two-candlestick reversal pattern that typically appears at the bottom of a downtrend. It signals that selling pressure is weakening and a potential bullish reversal may occur. The pattern consists of:
- First Candle: A large bearish (red) candle that suggests strong selling momentum.
- Second Candle: A small bullish (green) candle contained within the body of the previous candle, indicating a slowdown in selling.
Why Does This Pattern Work?
The psychology behind the Bullish Harami pattern lies in market sentiment. The strong bearish candle represents aggressive selling, but the small bullish candle that follows shows hesitation from sellers and emerging strength from buyers. This indicates that bears may be losing control, and a potential reversal is on the horizon. Smart traders use this as an early signal to anticipate a shift in market direction.
💡 Key Insight: Institutional traders often look for such patterns near major support levels, increasing the probability of a bullish move. Retail traders who recognize this setup early can align their trades with institutional flows.
2. How to Identify a Bullish Harami on the Chart
Key Features of a Valid Bullish Harami
✅ Occurs after a clear downtrend ✅ First candle is large and bearish ✅ Second candle is small and bullish, contained within the first candle ✅ Works best when accompanied by confirmation signals (e.g., RSI, volume analysis, trend support levels)
Best Timeframes for Trading
- Higher timeframes (4H, Daily, Weekly) provide stronger signals and reduce false breakouts.
- Lower timeframes (15M, 1H) can be used for short-term scalping but require additional confirmation.
- Works well across forex, stocks, and crypto markets, where price action is significant.
📌 Pro Tip: The Bullish Harami becomes even more effective when occurring at key Fibonacci retracement levels (e.g., 61.8%) or long-term moving averages (50-day or 200-day EMA).
3. How to Trade the Bullish Harami Pattern Successfully
Entry Strategies That Work
- Aggressive Entry: Buy immediately after the pattern forms at key support.
- Conservative Entry: Wait for a third bullish candle to confirm momentum shift.
- Breakout Strategy: Enter above the high of the Bullish Harami pattern for extra confirmation and higher probability trades.
Stop-Loss & Risk Management
- Place stop-loss below the Harami low to protect capital and minimize losses.
- Use ATR (Average True Range) stops for adaptive stop-loss placement, allowing flexibility in volatile markets.
- Follow a risk-reward ratio of at least 1:2 for profitable trading, ensuring sustainable gains over time.
Why Risk Management is Crucial: Many traders ignore stop-loss placement and end up holding onto losing positions. Using proper risk-reward ratios ensures long-term profitability and survival in trading.
Take-Profit Strategies
- Target recent resistance zones for conservative exits, ensuring steady gains.
- Use Fibonacci retracement levels for extended profit targets when the trend continues.
- Implement a trailing stop-loss to maximize gains as the trend unfolds and prevent premature exits.
4. Common Mistakes When Trading the Bullish Harami
🚫 Entering Without Confirmation: Always verify with indicators like RSI and volume analysis before executing trades. 🚫 Ignoring Market Context: Avoid trading this pattern in sideways markets, where breakouts are less likely to be reliable. 🚫 Using Tight Stop-Losses: Market noise can trigger stop-losses prematurely; always allow for slight price fluctuations. 🚫 Misidentifying the Pattern: Ensure the second candle is fully contained within the first candle’s body, avoiding false interpretations.
💡 Trader’s Tip: Combining Bullish Harami with trend analysis (e.g., trendline support) significantly enhances its success rate.
5. Pro Tips: How to Combine Bullish Harami with Other Indicators
RSI & Stochastic: Look for oversold levels to confirm strength in the reversal.
Moving Averages: If price is above the 50 EMA, it adds confidence to the bullish signal.
Bollinger Bands: A bounce from the lower band combined with a Bullish Harami is a strong entry signal, reinforcing a reversal trend. 📌 MACD Crossover: A bullish MACD crossover strengthens the trade setup by confirming momentum shift.
📢 Advanced Insight: Volume analysis can further validate the trade. If the bullish candle in the Harami pattern has increased volume, it suggests stronger market conviction.
6. Real-World Examples: Bullish Harami in Action
Forex Trading Example
- EUR/USD forms a Bullish Harami at a key support level → Price rallies 100+ pips.
- Confirmation from RSI divergence adds further strength to the trade, increasing reliability.
- Volume analysis supports bullish sentiment, leading to a high-confidence entry.
Crypto Trading Example
- Bitcoin finds support at $40,000 with a Bullish Harami breakout strategy → Price surges to $44,000.
- Traders who waited for a higher timeframe breakout confirmation avoided false signals and secured better entries.
- Using Fibonacci extensions, traders set precise take-profit levels to maximize gains.
Why These Examples Matter: Real-world examples provide practical insights into how the Bullish Harami can be applied successfully across different asset classes.
7. The Future of Bullish Harami Trading
- The bullish harami trading strategy is a powerful tool when used correctly with confirmation indicators.
- Always combine it with other confirmation signals to improve accuracy and minimize false breakouts.
- Use a forex trading guide to refine your skills in identifying high-probability setups and mastering risk management.
- The trading guide outlined above provides a structured approach to making the most of this pattern and consistently profiting from it.
By mastering this trading candlestick pattern, traders can significantly improve their ability to spot high-quality trade setups and increase profitability. Start implementing these strategies today to refine your trading skills and build a more consistent approach to the markets. Successful trading is all about patience, discipline, and proper execution of strategies!
📌 Final Tip: Backtest the Bullish Harami pattern using historical data before applying it in live trading. A well-tested strategy increases confidence and profitability!


Leave A Comment