


GBP/JPY Bearish Breakdown: Key Support Levels in Focus
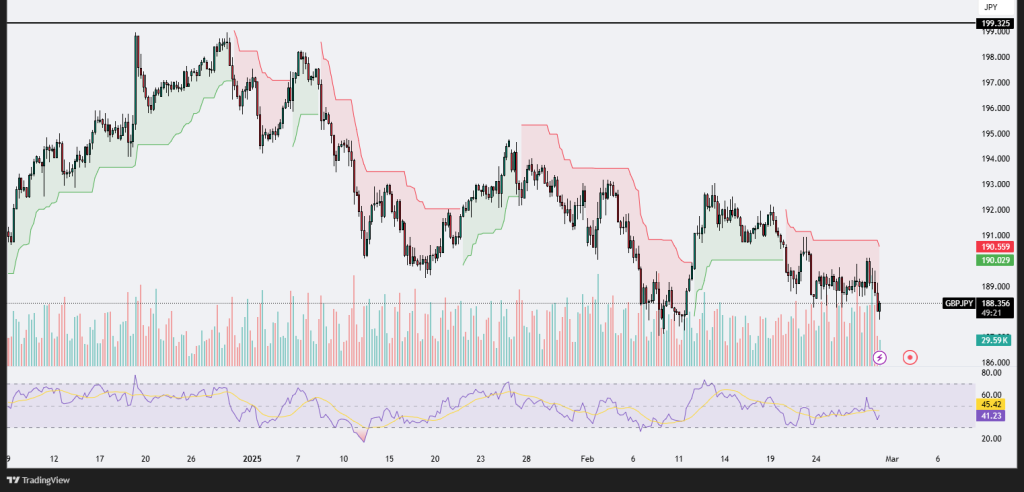
The GBP/JPY 4-hour chart is displaying a bearish continuation, with the price breaking below the 188.500 support level, now trading at 188.350. This downward movement follows a prolonged consolidation phase, where the price struggled to break above the 190.029 – 190.559 resistance zone. The Supertrend indicator remains red, reinforcing the bearish sentiment, and price action is forming lower highs and lower lows, confirming a downtrend. If the price continues its descent, the next key support level could be around 186.500 – 187.000, areas where buyers previously stepped in.
The volume profile shows increased selling pressure as the price breaks below consolidation, suggesting that bears are taking control. The most recent bearish breakout is accompanied by a noticeable spike in volume, indicating strong momentum. If volume continues to rise on bearish candles, it would confirm the strength of the downtrend. Conversely, a decline in volume could signal potential exhaustion and a possible retracement.
The Relative Strength Index (RSI) is currently at 41.16, hovering near oversold territory but not yet at extreme levels. This suggests that there is still room for further downside, but traders should watch for potential bullish divergence or RSI reaching 30, which could indicate a short-term rebound. If RSI fails to recover above 45-50, it would likely confirm further downside movement.
Overall, GBP/JPY remains bearish, with strong selling pressure pushing the price lower. The breakdown below 188.500 increases the probability of further losses toward 187.000 and potentially 186.500. However, if the price manages to reclaim 189.000, it could signal a short-term recovery towards resistance. Traders should monitor RSI for potential oversold conditions and watch volume for confirmation of momentum.
Euro Climbs as Market Awaits Key Moves in EUR/CAD Uptrend
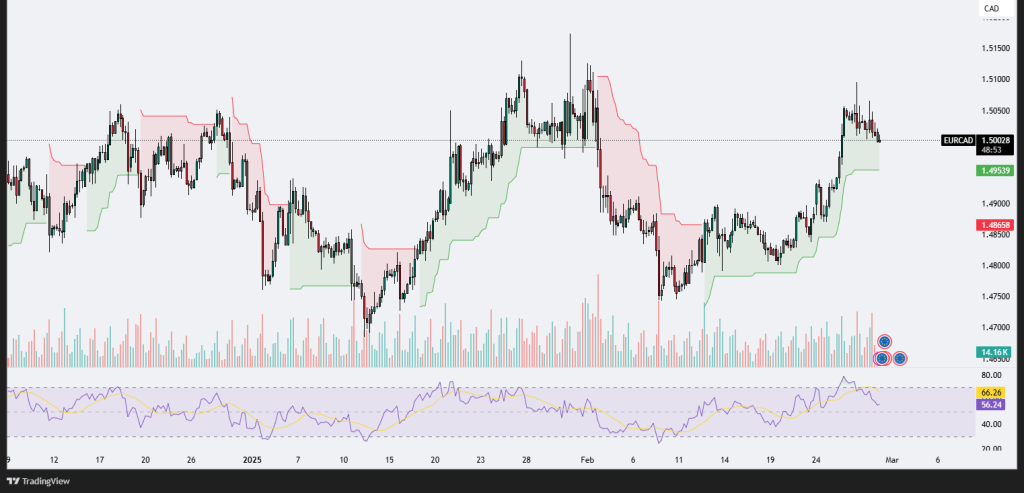
The EUR/CAD 4-hour chart reflects a strong uptrend, with the price currently trading around 1.50026 after a significant bullish rally. The price has recently reached a local high near 1.50500, but it is now experiencing a slight pullback. The Supertrend indicator remains green, confirming that the bullish momentum is still intact. A key support zone lies around 1.49539, which aligns with the recent breakout level. If this area holds, buyers may attempt another push towards the recent highs or even new highs. However, a breakdown below this support could signal a deeper retracement toward the 1.48658 – 1.48500 region.
Looking at the Relative Strength Index (RSI), which is at 56.19, it indicates that the market is cooling off after being in overbought territory (RSI peaked above 66). This suggests that some profit-taking is occurring, leading to a temporary pullback. If RSI remains above 50, it would indicate that bullish momentum is still present, and the uptrend could resume soon. However, if RSI drops below 50, it could signal increasing bearish pressure, leading to a larger correction.
Volume has slightly decreased during this pullback, which is a typical sign of a healthy correction rather than a strong bearish reversal. If buying volume increases near 1.49539, it could confirm that the uptrend is resuming. On the flip side, a high-volume breakdown below this level would indicate that sellers are gaining control, pushing the price lower.
Overall, EUR/CAD remains bullish, but traders should watch for how price reacts at the 1.49539 support level. A strong bounce could lead to new highs above 1.50500, while a breakdown may trigger a deeper retracement toward 1.48600 – 1.48500. RSI and volume will be crucial indicators to confirm the next move.
EUR/GBP Slides Below Key Support as Bears Dominate
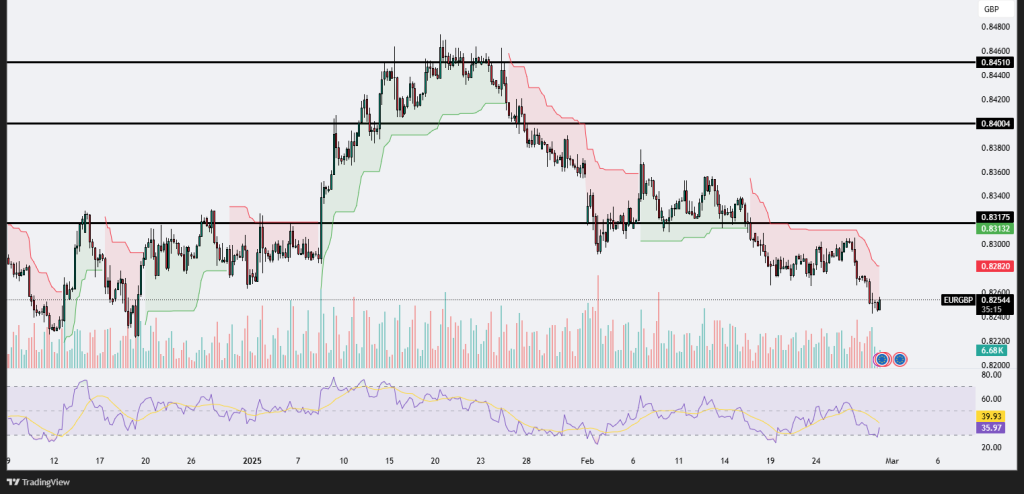
The EUR/GBP 4-hour chart is displaying a clear bearish trend, with the price currently trading at 0.82544, after breaking below the 0.82820 support level. The bearish momentum has been strong, with a series of lower highs and lower lows, confirming a downtrend. The Supertrend indicator remains red, further supporting the bearish sentiment. Key resistance levels are now positioned at 0.83175, 0.84004, and 0.84510, with each of these levels acting as potential barriers if the price attempts a recovery. The most immediate challenge for bulls would be reclaiming 0.82820, which has now turned into resistance.
Looking at volume, the recent selling pressure has been accompanied by a moderate increase in trading activity, indicating that sellers are still in control. If volume continues to rise on further bearish price action, it would suggest that the downward movement is sustainable. However, a decline in selling volume could indicate potential exhaustion and the possibility of a short-term bounce.
The Relative Strength Index (RSI) is currently at 35.97, approaching the oversold region but not quite there yet. This suggests that while EUR/GBP is in a strong bearish trend, a possible short-term retracement could occur if RSI dips below 30 and then rebounds. If RSI fails to recover above 40, it would indicate continued bearish strength. However, if it starts climbing toward 50, it could signal the beginning of a consolidation or reversal phase.
Overall, EUR/GBP remains in a strong downtrend, and further downside could be expected unless price reclaims 0.82820 as support. If the bearish momentum continues, the next psychological support level could be around 0.82000. Traders should monitor RSI for potential oversold conditions and volume for confirmation of trend continuation or possible exhaustion.
AUD/CAD Breaks Key Support: Bearish Momentum Intensifies
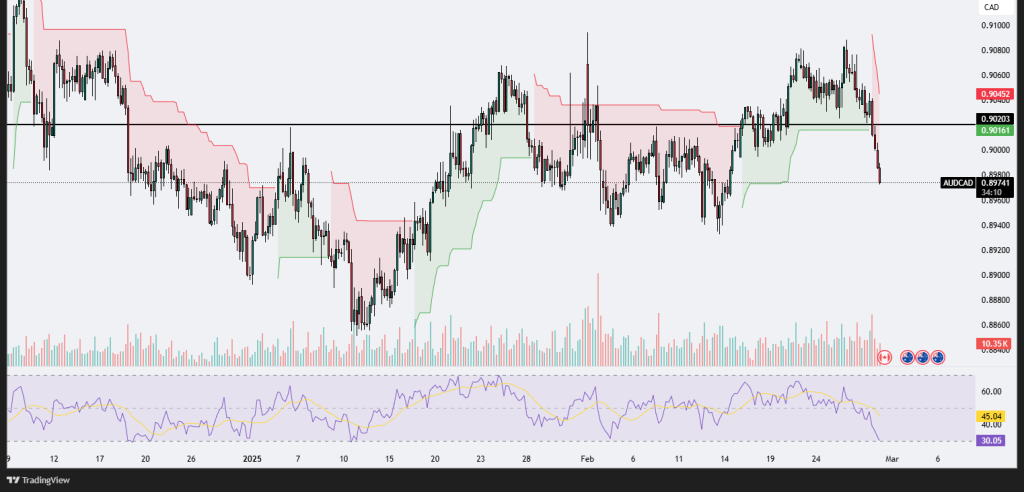
The AUD/CAD 4-hour chart shows a strong bearish breakdown, with the price dropping sharply below the 0.90203 key support level, now trading at 0.89741. This breakdown marks a shift in market structure, as previous attempts to hold above 0.90203 failed, leading to increased selling pressure. The Supertrend indicator has turned red, confirming that the trend is now bearish. With price decisively moving below this critical support level, the next potential support zone lies around 0.89500 – 0.89250, which could act as a target for further downside movement.
The Relative Strength Index (RSI) has dropped to 30.05, entering the oversold territory. This suggests that the bearish momentum is strong, but also that a short-term pullback or consolidation could occur soon. If RSI drops further below 30, it may indicate extreme selling conditions, increasing the chances of a temporary rebound. However, if RSI struggles to reclaim 40-45, it would confirm continued bearish momentum and potential for further decline.
Looking at volume, there has been a noticeable increase during the breakdown, which suggests strong conviction among sellers. If this high selling volume continues, AUD/CAD could decline further toward the next major psychological level at 0.89500. However, a declining volume on further downside moves could indicate that selling pressure is weakening, leading to a potential short-term bounce back toward the 0.90203 – 0.90452 resistance zone, which has now turned into a key barrier.
Overall, AUD/CAD is in a confirmed bearish trend, with a strong breakdown below a crucial support level and momentum indicators signaling further downside risk. If the price continues to close below 0.90000, it increases the probability of a move toward 0.89500 – 0.89250. However, traders should watch for a possible RSI-based bounce, especially if price starts consolidating around current levels. If bulls attempt a recovery, 0.90203 now acts as a strong resistance, and only a decisive break above it would indicate a shift in sentiment.


Leave A Comment